Research Highlights 2005
 |
 |
 |
 |
TerraneChron®
TerraneChron® is GEMOC's unique methodology for terrane evaluation. Industry continued extensive use of TerraneChron® as a cost-effective tool for mapping crustal history on different scales.
Iron isotopes and Earth's oxygen budget
After the accretion of the earth from meteoritic debris, oxygen stored in the deep interior (the mantle) was released to the surface as water and CO2, and free oxygen in the atmosphere grew to a significant level by ~2.4 billion years ago. However, we do not know how oxygen is distributed in the mantle, and how this has varied with depth and over time.
To understand how oxygen varies in the mantle, we need to measure some feature of rocks or minerals that is highly sensitive to small changes in the amount of oxygen present. The variable oxidation states of iron (Fe3+, Fe2+ , native Fe) potentially provide such a tool, and new multiple collector inductively coupled plasma mass spectrometry (MC-ICPMS) techniques have shown correlations between the stable isotope composition of iron and its oxidation state. Recent work has demonstrated that the iron isotope compositions of spinels (an aluminium-rich oxide present in mantle rocks that hosts variable amounts of Fe3+) correlate with the oxidation state of their host rock (Fig. 1); iron isotopes can therefore be used as a proxy for relative changes in mantle oxidation state. By analysing the iron-isotope compositions of minerals in mantle xenoliths originating from different depths and of different ages it will be possible to get some idea of how the level of oxidation of the mantle has changed over time. Ultimately, GEMOC scientists will be able to use this method to probe the Earth's deep interior and find out how much oxygen there is, why it's there and where it all may have come from.
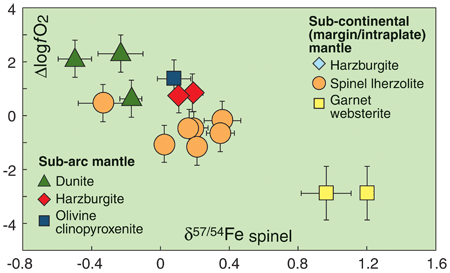
Figure 1. Spinel iron isotope composition (δ57/54Fe; the deviation of the measured 57/54Fe ratio from that of the pure iron standard IRMM-14 in parts per 1000) versus ΔlogfO2, expressed relative to the fayalite-magnetite-quartz buffer, FMQ)
However, iron participates in a range of mass-transfer processes that take place in the mantle, such as partial melting and metasomatism, and these processes, in addition to changes in oxidation state, may influence the iron isotope signatures recorded in mantle rocks. Therefore, it is important to constrain first how iron isotopes behave during partial melting, in different melting environments (eg spinel versus garnet-facies peridotites) and how isotopic fractionation may be influenced by metasomatic processes. With a good understanding of how such processes contribute to the iron isotope signatures of mantle rocks, we can "deconvolve" the iron isotope compositions of mantle rocks and interpret them in terms of changes in mantle oxidation state.
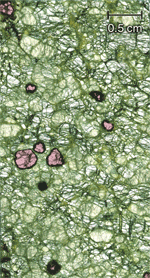
Figure 2. Thin section (viewed in plane-polarised light) of sample LT98/10, a garnet peridotite xenolith from North Lesotho, Kaapvaal Craton.
As stable isotope fractionations at high temperature are believed to be extremely small (typically no more than 0.5 per mil, or a few parts per 10,000) the development of ultra-high precision MC-ICPMS techniques is required. This has been achieved at GEMOC using a standard-sample bracketing technique in conjunction with external normalisation; the standard reproducibility is now well below 0.1 permil for the 57Fe/54Fe ratio. Our next goal is to obtain iron isotope data for minerals separated from well-characterised xenoliths from the Lesotho, Kimberley and Finsch localities in the Kaapvaal craton, South Africa. These xenoliths represent variably depleted and metasomatised garnet-bearing SCLM. By studying these xenoliths, which contain garnet, olivine, orthopyroxene and clinopyroxene as major phases (Fig. 2), we can constrain the behaviour of iron isotopes during partial melting and evaluate the effects of metasomatism. Further work will focus on analysing xenoliths of different ages from different cratons with a view to evaluating how the oxidation state of the lithospheric mantle has changed with time.
Contact: Helen Williams
Funded by: Nu Instruments Fellowship, ARC
Trace elements are a girl's best friend: How diamonds form
 Natural diamond crystals form at high temperatures and pressures in the Earth's mantle. Because diamond is chemically inert under most natural conditions, these crystals act as 'time capsules' that provide us with valuable direct samples of the mantle and records of mantle processes during diamond formation. It is now widely accepted that most, and perhaps all, diamond crystallises from fluids percolating through mantle. The structure of diamond is so tight that it excludes elements other than carbon, nitrogen and occasionally trace amounts of boron. However, during its crystallisation, diamond commonly traps small inclusions of silicate, oxide and sulfide minerals. Trace amounts of the fluids from which the diamond grew also are found, trapped in microscopic to submicroscopic fluid (±solids±vapour) inclusions. These inclusions can yield information about the chemical, isotopic and mineralogical composition of the host rocks and the nature of the fluids from which the diamond formed.
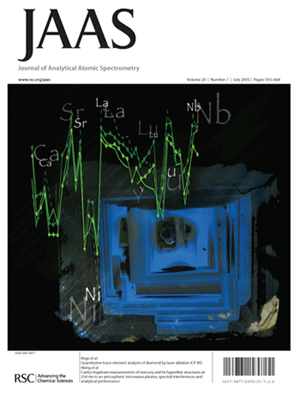
Figure 1. Rege, S., Jackson, S.J., Griffin, W.L., Davies, R.M., Pearson, N.J. and O'Reilly, S.Y. 2005. Quantitative trace element analysis of diamond by laser ablation inductively coupled plasma mass spectrometry. Journal of Analytical Atomic Spectroscopy 20, 601-610.
GEMOC has developed a technique for the quantitative trace-element analyses of > 40 elements in diamond by LAM-ICPMS, using a multi-element doped-cellulose standard; detection limits range to low-ppb levels for many elements. This unique method was featured as a "hot topic" lead article in the prestigious Journal of Analytical Atomic Spectroscopy in 2005 (Fig. 1; Publication #407). The technique was used to analyse >500 diamonds of different types, and from different localities worldwide, and the data provide exciting new insights into the processes of diamond crystallisation in the mantle.
The structures of polycrystalline (framesite, diamondite) and fibrous or particulate diamonds indicate that they crystallised rapidly, probably from carbon-oversaturated fluids. Their trace-element patterns are consistent with crystallisation from kimberlitic-carbonatitic melts, which may show significant compositional variation from locality to locality. However, many fibrous/particulate diamonds show an abrupt change in trace-element patterns as crystallisation proceeds. Large decreases in Nb/Ta and Zr/Hf are difficult to explain by fractional crystallisation, but can be modelled as the result of liquid immiscibility: a separation into broadly hydrous-silicate and carbonatite fluids. This process can produce very large elemental fractionations (Fig. 2). The ubiquitous development of pronounced negative Y anomalies (relative to Ho-Dy) may reflect the further separation of fluoride phases or immiscible fluoride melts.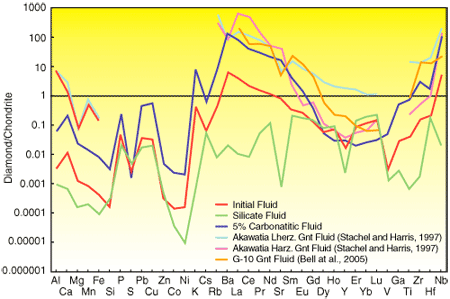
Figure 2. Diamond-related fluids. The"initial fluid"represents the mean of ca 200 fibrous/particulate/polycrystalline diamonds worldwide, and resembles the patterns of many kimberlites and carbonatites. The "silicate fluid" represents the mean of ca 200 monocrystalline diamonds worldwide. The "carbonatitic fluid" is calculated assuming that the initial fluid separated into the silicate and carbonatitic fluids in the ratio 95:5. The fluids in equilibrium with harzburgitic (subcalcic Cr-pyrope) garnets and lherzolitic (Ca-saturated) garnets were modelled by Stachel and Harris (1997).
Despite significant variation from one deposit to another, nearly all monocrystalline diamonds from localities worldwide show low LREE/HREE, Ba/MREE and Sr/LREE, as well as low Nb/Ta and Zr/Hf, suggesting that they have crystallised from the hydrous-silicate member of the proposed immiscible-liquid couple. Modelling of the conjugate Mg-rich "carbonatite" liquid shows it would have extremely high LREE/HREE and Sr (Fig. 2). The composition of this fractionated carbonatitic fluid can explain one of the unusual features of diamond-related minerals worldwide. One of the most common inclusions in diamond, and one of the most ubiquitous "indicator minerals" used in diamond exploration, is subcalcic Cr-pyrope garnet with "sinuous" REE patterns and high Sr contents (Fig. 3). Attempts to model a liquid from which such strange garnets would crystallise produce trace-element patterns with extreme element fractionations, not observed in known rocks; this conundrum has led most researchers to conclude that the subcalcic Cr-pyropes represent metasomatic modification of pre-existing garnets. However, the modeled fluids correspond closely to the immiscible "carbonatitic" end-member fluid predicted from the diamond trace-element data (Fig. 2).
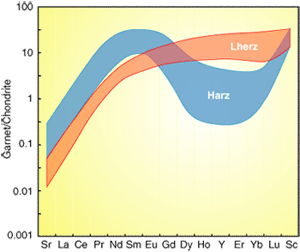
Figure 3. Trace-element patterns of garnets from lherzolites and harzburgites.
It appears that the reaction of this fluid with chromite + olivine + opx in the harzburgitic mantle wall rocks can produce the unusual garnets which are a characteristic inclusion in diamonds of the peridotitic paragenesis worldwide. In contrast, metasomatism by the original kimberlite-carbonatite fluid would produce the more common lherzolitic garnets (Fig. 2). We therefore suggest that the development of immiscibility during the evolution of low-volume melts of the kimberlite-carbonatite spectrum produces conjugate fluids, one of which crystallises most monocrystalline diamonds, and the other of which interacts with mantle harzburgites to produce the most ubiquitous inclusions in peridotitic diamonds. These new models have interesting implications not only for diamond exploration, but for the origin and nature of the original Archean mantle.
Contacts: Sue O'Reilly, Bill Griffin, Sonal Rege
Funded by: ARC, Macquarie University
Intraplate volcanism, mantle dynamics and diamond exploration
Intraplate volcanism, which is not directly related to plate boundaries, can give us insights into mantle dynamics beneath the plates, and enhance our understanding of mantle-derived mineral resources, such as diamonds. The most voluminous intraplate volcanics have been attributed to hotspots - active volcanic zones not attributed to plate boundary processes. The most widely accepted origin for most hotspots is mantle plumes: hot, buoyant upwellings of mantle material that may originate as deep as the core-mantle boundary, and on reaching the surface may cause intense, localised zones of volcanism.
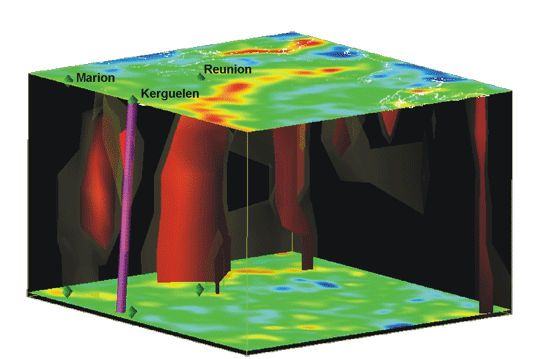
The most remarkable thing about these mantle plumes is that they seem to have moved very little compared to the plates, almost as if they were rooted in the deep mantle. More detailed analysis, particularly from paleomagnetic data, has shown that in fact these plumes do move, sometimes quite rapidly, as if being blown by the "mantle wind".
Figure 1. Velocity anomalies in the Indian Ocean and their relationship to major hotspots. The coloured slices are velocity anomaly cross-sections at 50 and 950km (red minimum velocities in given layer, blue maximum). Coastlines are shown in white. Red contours show -0.75 velocity anomalies, and yellow (translucent) contours the -0.6 anomalies. The purple tube shows the calculated tilt of the Kerguelen hotspot.
Three-dimensional convection simulations can determine the strength of the mantle wind, and the motion of plumes in it. Using high resolution data on past plate motions, and detailed density models of the Earth based on global seismic tomography, the mantle velocity field was calculated for the last 120 Myr. This involved a significant technological leap: backwards convection simulations are technically impossible, since thermal diffusion is an inherently one-way process. However, the use of a modified diffusion relation, and an evolutionary computation approach in which the simulations are coupled to real-world constraints on the system, overcame these difficulties.
The calculated motion of major mantle plumes is consistent with available evidence on their motion from paleomagnetism, and with the deep structure of these plumes from high-resolution tomography. Additionally, their motion explains several long-standing geodynamic conundrums, such as how to reconcile a Kerguelen-plume origin for the Rajmahal Traps in northern India, and the Ninetyeast Ridge, when the present-day position of the Kerguelen hotspot is in the wrong place to form these features. Our model of Kerguelen plume motion alleviates such problems.
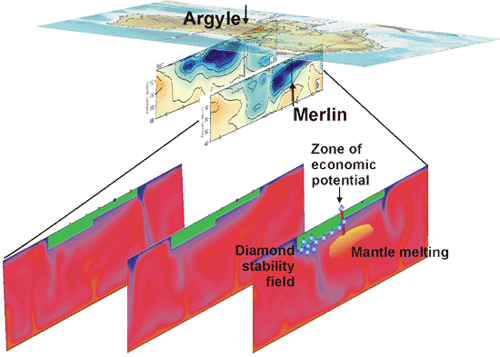
Figure 2. Vertical slices through the tomographic model of Frederik Simons, at the positions of Argyle and Merlin. Both Argyle and Merlin lie on strong gradients in lithospheric thickness. Also shown is the temperature field from mantle convection simulations incorporating a fixed continent (green). The intersection of the diamond stability field (blue diamonds) and mantle melting (yellow) indicates regions of economic potential.
The interaction of mantle upwellings with the continental lithosphere determines the surface distribution of volcanic rocks - including diamond-bearing rocks such as kimberlites and lamproites. These hot mantle upwellings also can modify the thermal state of the overlying lithosphere, potentially destroying lithospheric diamonds before they can be entrained in the rising magmas. Our simulations tracked the evolution of the thermal conditions in the lithosphere and melting in a convecting mantle. The results show that while diamonds are preferentially stable in the deepest portions of thick, cool continental lithosphere, it is very difficult to generate melt in these regions. Melting preferentially occurs when mantle can upwell to shallow depths beneath thin lithosphere - a situation not conducive to diamond stability. Therefore the regions most conducive to the sampling of diamonds by upwelling magmas are on the periphery of thick lithospheric roots. Interestingly, Australia's economic diamond deposits (Argyle, Merlin and Ellendale) all lie on the boundaries of thick lithospheric domains, suggesting a fundamental link between mantle dynamics, mantle melting, and the distribution of diamond deposits.
Contact: Craig O'Neill
Funded by: University of Sydney Postgraduate Award, NASA-MDAT and NSF grants, Macquarie University Research Fellowship
Hot stuff: Geotherms, density and seismic velocity
Mantle xenoliths provide detailed information on the composition of small volumes of subcontinental lithospheric mantle (SCLM) beneath individual volcanic fields; the challenge for the geologist is to extend that information to larger volumes of the lithospheric mantle. Seismic tomography provides stunning images that carry information on the structure of the SCLM, and potentially can be used to map the deep interior. Global tomographic studies show that "roots" with high seismic velocities extend to depths of 150-300 km under Archean cratons, while younger areas typically show thinner "roots", with somewhat lower velocities and extend to lesser depths. Seismic tomography is typically interpreted in terms of thermal variations. However, calculations of seismic velocities for mantle-derived xenoliths show that variations in mantle composition can account for as much as 25% of the observed velocity range. We have developed a methodology for evaluating the relative contributions of temperature and composition, and produced maps of regional geotherm and broad compositional constraints on the SCLM from the inversion of shear-wave (Vs) seismic tomography (Deen et al., 2006, GEMOC publication #423).
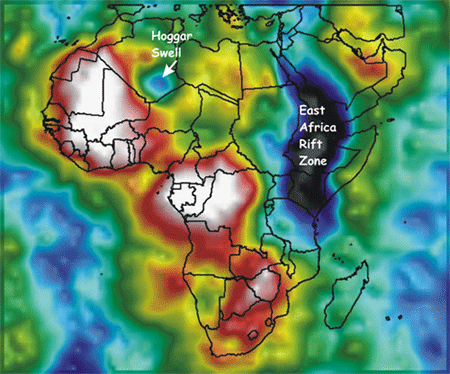
Figure 1. Distribution of shear-wave seismic velocity (Vs) for the range 100-175 km beneath Africa. Zones of relatively higher shear-wave velocity are red and white, while slower velocities are blue and black. Tomography reprocessed by WMC Resources (Perth), from Grand (1997).
The approach removes the temperature and pressure effects from the in situ density of the lithosphere, allowing definition of upper mantle regions showing broad differences in lithospheric composition. The methodology uses empirical model geotherms quantized in steps of 2.5 mW/m2, and three mantle compositions corresponding to typical Archean, Proterozoic and Phanerozoic SCLM. Starting from an assumed composition for a volume of SCLM, lithospheric density at surface pressure and temperature is calculated for each geotherm at each point; the optimum geotherm is taken as the one yielding a density closest to the mean value derived from mantle xenoliths (3.31 g/cm3). Results requiring densities or geotherms outside the known natural range of these parameters worldwide require the choice of a different mantle composition. This technique, applied iteratively to a 275 km x 275 km Vs model (Fig. 1) developed by Professor Steve Grand (University of Texas at Austin; Grand, 1997 GSA Today, 7), results in maps of the geotherm and regional density, which allow interpretation of SCLM composition within broad limits. Applying this technique to the lithosphere beneath Africa (Fig. 2), thick Archon-type roots are shown to underlie the cratons, including the West African craton which has a deformed Proterzoic cover. The Kalahari craton, in contrast, has a relatively small core of Archon-type material, surrounded by mantle modified during the Proterozoic. The East Africa Rift cannot be modelled using this technique; no geologically reasonable combination of composition and temperature can produce the observed low Vs. This result implies the presence of melts or other fluids at 100-175 km in this region. The Hoggar Swell is underlain by Tecton-type mantle with a high geotherm; this feature may image a narrow hot upwelling responsible for the domal uplift and volcanism in the region. These results can be compared with local (paleo)geotherms and data on mantle composition, derived from xenolith suites (Fig. 3). Application of this technique to the SCLM beneath Africa, Siberia and North America shows good correlation with regional geological features, xenolith data and other geophysical data.
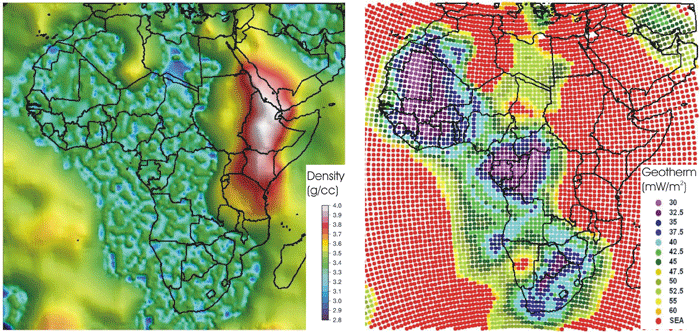
Figure 2. Calculated density (left) and corresponding geotherm values in mW/m2 (right) for the lithosphere beneath Africa.
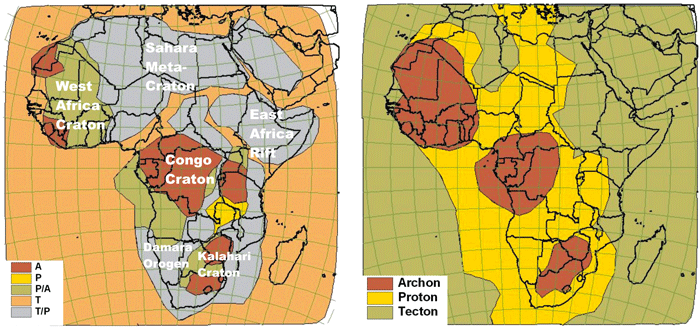
Figure 3. (A) Upper Lithospheric domains indicating the tectonothermal age of lithospheric volumes determined from mapping of geology and geophysics, labelled with broad geographical regions referred to in the text; A=Archon, P=Proton, T=Tecton, P/A=Proton-reworked Archon, T/P=Tecton-reworked Proton. (B) Generalised mantle types at 100-175 km depth, interpreted from Figure 2.
Contacts: Tara Deen, Sue O'Reilly, Bill Griffin
Funded by: Macquarie University, ARC Linkage (O'Reilly, Griffin), WMC Resources
Isotopic ratio measurement using microbeam methods: Where do we stand and where are we going?
his was the title of a session co-convened by Norm Pearson at the 15th Goldschmidt Conference, held in Moscow, Idaho in May 2005. The session brought together researchers using SIMS and laser ablation MC-ICPMS for in situ isotope ratio analysis in the geosciences and profiled the advances that had been made by each group.
Since the late 1990s GEMOC has been at the forefront of the development of in situ isotope ratio measurements using laser ablation multi-collector ICPMS. The developments encompass both 'non-traditional' stable isotopes (eg Mg, Fe, Ni, Cu, Zn) and radiogenic isotopic systems (eg Sr, Nd, Hf, Os, Pb). Previous research highlights have showcased the applications of in situ Hf isotopes in zircon and rutile, Os isotopes in mantle sulfides, Cu and Fe isotopes in chalcopyrite and pyrite in ore deposits and Mg in mantle olivine. These new methods have had an enormous impact on our understanding of the evolution of the crust and mantle and have changed the way we study processes that recycle or modify the lithosphere.
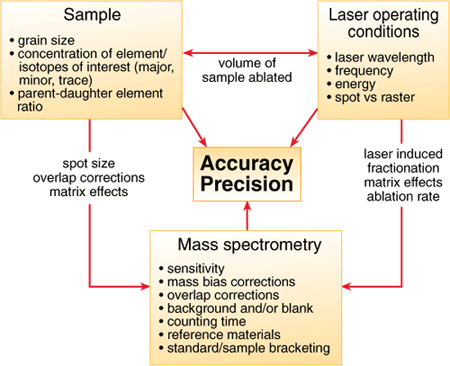 Figure 1.
Along the way we have also made significant contributions to understanding the fundamental processes of laser ablation (Publication #311) and investigated corrections for mass bias and isobaric overlap for plasma-source mass spectrometry (eg Publications #179, 267).
What have we learned and what does the future hold? What improvements need to be made and can be made?
The benefits to be had using laser ablation rather than conventional techniques, and the issues that must be addressed to produce high quality data, can be summerised in a table.
| Advantages | Disadvantages |
| · spatial resolution | · 'dirty' samples |
| · (no) sample preparation (i.e. chemical purification) | · overlap corrections for parent/daughter isotopes |
| · high sample throughput | · matrix effects and matrix matching |
| · greatly reduced (no) memory | · availability of suitable reference materials |
| · no solvent interferences | · spot size vs sensitivity (precision) |
| · laser-induced isotopic fractionation |
From the petrologist's viewpoint, in situ analysis allows the isotopic data to be interpreted in a microstructural context and in the framework of geochemical data from other microanalytical techniques. The in situ capabilities allow for the first time the investigation of isotopic variation at the sub-millimetre scale and in doing so have raised questions concerning the validity and interpretation of whole-rock measurements (eg Publication #326).
From an analytical viewpoint our current knowledge can be summarized in the context of the factors that control the accuracy and precision of in situ analysis. Ultimately accuracy and precision will depend on the interplay of several factors, including the composition of the sample, signal intensity, correction procedures and analysis time (Fig. 1).
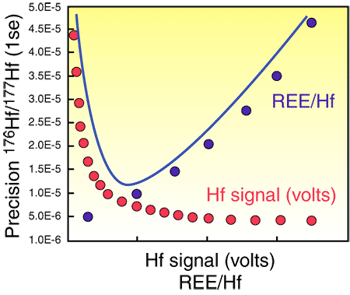
Figure 2. Internal precision for 176Hf/177Hf as a function of total Hf signal intensity and REE/Hf ratio. The curve shows the relative importance of low signal intensity and high REE/Hf as the main controls on precision.
The methods developed so far fall into two broad groups based on the properties of the sample: (1) the analysis of stable-isotope ratios where the element of interest is a major element in the mineral and (2) radiogenic isotope measurements of an element which is present in minor or trace amounts in the mineral. At one end of the spectrum, laser ablation is a 'true' microanalytical technique with spatial resolution of 30-50 microns, which is comparable to most ion probes. As we strive to obtain the best precision for isotopic ratios of elements in low concentrations (<100 ppm) it becomes necessary to use spot sizes on the order of several hundred microns. While this still has many of the benefits outlined above, the laser effectively becomes a bulk-sampling device and within-grain variations cannot be determined unless the grain size is relatively coarse. Improvements in the sensitivity of mass spectrometers therefore are required to enable the use of smaller spot sizes. The other main issue encountered with radiogenic systems at the trace abundance level is the parent-daughter elemental ratio. The corrections for isobaric interference are a significant factor in the accuracy and precision of in situ measurements of Sr, Nd, Hf and Os isotopes. Figure 2 shows the combination of the uncertainties associated with signal sensitivity and interference corrections on the analytical precision of Hf-isotope measurements.
One of the main problems faced by all microanalytical techniques is the availability of suitable reference materials, i.e. materials that are homogenous on the scale of tens of microns. As an example, since we began in situ analysis of Hf isotopes in zircon in 1999, we have routinely analysed two reference zircons (91500 and Mud Tank) and in the process built up large databases of results. 91500 shows considerable heterogeneity in 176Hf/177Hf; the distribution is essentially bimodal with major peaks at 0.282284±22 and 0.282330±29 (2σ) (Fig. 3). By comparison, the long-term average and variance for 176Hf/177Hf of our LAM-MC-ICPMS data for the Mud Tank zircon is 0.282523±43 (2σ, n= 2190). This dataset has a single peak; although no natural zircon may be homogeneous at the scale of laser ablation, our data indicate that Mud Tank is more homogeneous than 91500.
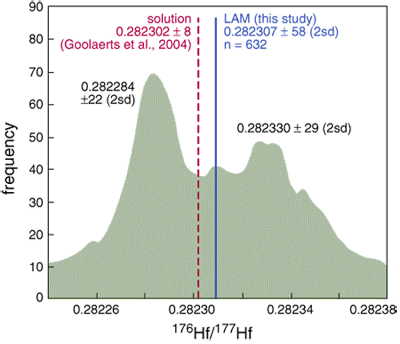
Figure 3. Cumulative-probability histogram of GEMOC's LAM-MC-ICPMS analyses of 176Hf/177Hf in zircon "standard" 91500.
While the Holy Grail of in situ isotope analysis might be to analyse the Nd-Sm or Lu-Hf systems in garnet or the Rb-Sr system in K-feldspar, this will need far greater instrumental sensitivity than is currently available, and some form of on-line chemical separation to remove isobaric interferences.
The introduction of in situ microanalysis of isotopic compositions is bringing about a revolution in the Earth Sciences comparable to the introduction of the electron microprobe (EMP) in the 1960s. As the development of EMP made petrologists look at the details of chemical processes, the analysis of isotopic ratios by SIMS and laser-ablation is forcing isotope geochemists to rethink the meaning of their data. While the in situ techniques still have the definite limitations as described above, the advantages (and the challenges) are obvious.
Contacts: Norman Pearson, Bill Griffin, Sue O'Reilly
Funded by: ARC LIEF, DEST SII, Macquarie University, ARC Large, Discovery, SPIRT and Linkage, industry collaborations
Ancient abyssal peridotites
The plate-tectonics model has driven the study of mid ocean-ridge magmatism, as it is one of the most obvious expressions of the mantle convection associated with plate tectonics. In this model, melting of the upwelling convective mantle at mid-ocean ridges produces two complementary products: a depleted mantle residue and an igneous crust (i.e. MORB, dykes and gabbros). It is widely accepted that Abyssal Peridotites (AP) drilled or dredged from the ocean floor (eg the Ocean Drilling Program campaigns) represent this residue after MORB extraction. If so, they should provide insights into the nature, evolution and processes that affect the MORB source mantle, i.e. the convective upper mantle. Furthermore, because they are presumed to be recently incorporated into the lithosphere, their geochemistry might tell us about the evolution of the convective upper mantle.
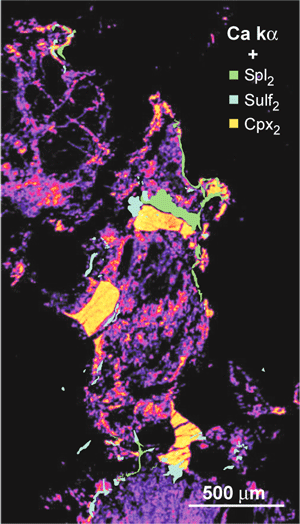
Figure 1. Chemical (Ca) map of an abyssal peridotite from Leg147 (Hess Deep, fast spreading ridge). The image shows the chemical imprint of melt percolation on the primary assemblage that makes up the AP (Ol1-Opx1, not shown here). Under lithospheric conditions the percolating melt crystallises secondary clinopyroxene (Cpx2≈ "impregnation" cpx) and secondary sulfide (Type-2 sulfide (Sulf2)) ± secondary spinel (Spl2).
[Note that this metasomatism does not always lead to a fertilisation of the whole rock as commonly assumed. Indeed, the percolating melt is often characterised by a depleted REE pattern resembling those described as inclusions in olivine phenocrysts in MORBs and dubbed "Ultra- depleted Melt".]
However, a number of studies have shown that the "magmatic" history of abyssal peridotites is far more complicated than previously thought. The decay of 187Re to 187Os offers a new perspective on these issues. Unlike other long-lived isotopic systems such as Rb-Sr or Sm-Nd - which consist of incompatible lithophile (i.e. magmaphile) elements - Os behaves as a highly compatible element during melting and is retained in the mantle, whereas Re is moderately incompatible and enters the melt. Sulfides are the main carrier of highly siderophile elements in the mantle, including Os and Re. Recent studies have shown that several sulfide populations, characterised by different micro-structural occurrence and composition, coexist at the thin section scale and record various episodes of melting and melt/rock reaction events. Thus by establishing the Re-Os isotopic systematics of the different sulfide populations (using LAM-MC-ICPMS), we can shed some new light on the intricacy of melt extraction and percolation processes beneath mid-ocean ridges.
Two populations of magmatic sulfides have been recognized in most AP or oceanic-related peridotites from all geodynamic settings. Type-1 sulfides are associated with the primary silicate assemblage; their composition and trace element abundances (eg Pd/IrN<1) indicate that they are residual after melting. Type-2 sulfides are associated with secondary, "impregnation" Cpx2. This feature, along with their high metal/sulfur ratios (Ni-, Cu-rich) and their high Pd/Ir (Pd/IrN>1) demonstrate that these sulfides were precipitated by melt-rock reaction.
Type-1 sulfides in AP from the Kane fracture zone (Mid-Atlantic Ridge) have 187Os/188Os as low as 0.110. Such unradiogenic values are indicative of a long-term evolution in a low Re/Os environment (i.e. depleted lithospheric mantle) and yield Re-depletion ages (TRD) of ca. 2.3 Ga. Type-2 sulfides in contrast have radiogenic compositions with 187Os/188Os ranging from 0.13 to 0.20. Although this typical of the Os-sulfide systematics observed in most APs worldwide, in Leg 209 (15°N-MAR), Type-2 sulfides have a narrow range of extremely unradiogenic Os yielding TRD ages of ca. 2.6 Ga and are older than Type-1 sulfides (ca. 2.3Ga). Associated Cpx2 are extremely depleted in trace elements (eg REE). This indicates that the percolating melt was here derived from an old and depleted mantle reservoir. Similar melt compositions have been found as inclusions in MORB olivine phenocrysts.
A broader survey shows that Archean or lower-Proterozoic Os model ages are quite commonly (almost systematically) found in whole-rock and/or sulfide Re-Os analyses in abyssal/oceanic-related peridotites. However, as shown in Figure 2, such age distributions are typical of sub-continental lithospheric mantle (SCLM) such as that sampled by orogenic massifs.
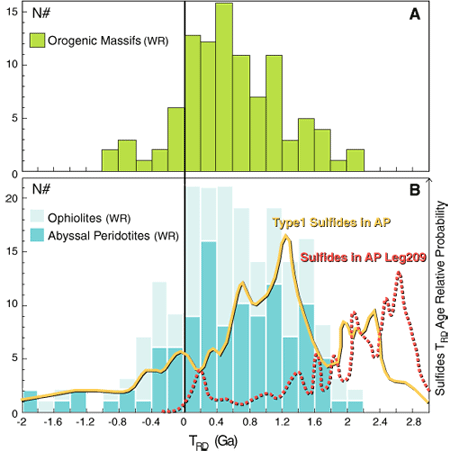
Figure 2. A, Whole-rock Re-depletion ages (TRD) for orogenic massifs (Pyrenees M, Ronda, Beni Bousera). B, Whole-rock TRD ages for Abyssal peridotites from worldwide occurrences (MAR, EPR, SWIR, IBM) and for ophiolites and oceanic-derived massifs (Oman, Ligurides, Horoman). The orange line shows TRD age frequency for Type-1 sulfides found in AP and ophiolites from worldwide occurrences (MAR, EPR, SWIR, Ligurides). The red line shows the TRD age frequency distribution for sulfides in abyssal peridotite from the recent ODP campaign Leg 209 (15°N, MAR).
Re-depletion age (TRD) assumes that all Re has been removed from the residue during melting (187Re/188Os sample=0) and thus yields a minimum depletion age, but is more 'robust' to addition or removal of Re by recent/secondary processes. Metasomatism or alteration cannot lower 187Re/188Os; thus these old TRD ages are 'robust' minimum depletion ages (i.e. not due to model artefacts).
This observation suggests that these "oceanic" mantle sections may represent either relicts of the disrupted SCLM entrained during continental break-up, or volumes of SCLM that have been recycled through subduction and are "popping-out" later in the ocean basins. These relict "SCLM rafts/corks", which are depleted and thus less dense than the asthenospheric mantle, could be buoyant and viscous enough to maintain cohesion and 'surf' the convective upper mantle for extensive periods of time. Along with other observations, this model suggests that a significant proportion of the so-called "convective upper mantle" (the MORB source mantle) actually is ancient and highly depleted, and has a protracted history of melting and metasomatism long predating the onset of oceanic rifting.
Contacts: Olivier Alard, Sue O'Reilly, Bill Griffin
Funded by: ARC Discoverycratons with a view to evaluating how the oxidation state of the lithospheric mantle has changed with time.
Where does the Houghton Inlier belong? Zircons hold the key!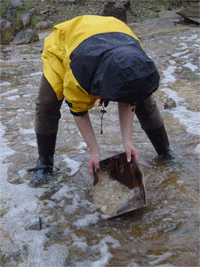
A series of collaborative projects between GEMOC and Primary Industry and Resources South Australia (PIRSA) has been aimed at building up a broad picture of the crustal evolution of the Gawler Craton. One subproject is addressing the geological affinities between the Craton and various Precambrian inliers in the younger mobile belts that fringe the eastern margin of the craton, including the Houghton Inlier and the Curnamona Province (Fig. 1). The results illustrate the power of the integrated in-situ microanalysis of Pb and Hf isotopic compositions of zircon (the TerraneChron® methodology) for the analysis of tectonic problems.
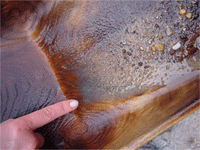
Elena panning for zircons in the South Para River.
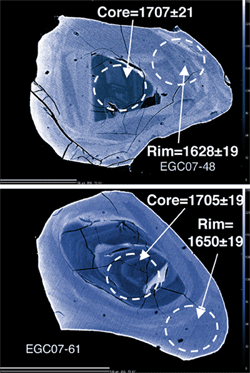
The methodology has been applied to detrital zircons from locally-derived stream sediments in the South Para River, which samples the Houghton Inlier. The zircons record two major events at 1718 ± 8 Ma and 1625 ± 9 Ma (Fig. 2). The details of zircon morphology and internal structure, imaged by combined cathodoluminescence/backscattered electron techniques (Fig. 3) can be used to identify the geological significance of the two age peaks. The zircons of the 1718 Ma population commonly show oscillatory zoning, typical of igneous zircons. In many grains, these oscillatory-zoned domains occur as resorbed cores, which are overgrown by structureless rims interpreted as metamorphic zircon. The 1625 Ma age population represents these metamorphic overgrowths, and single anhedral grains that lack internal structure.
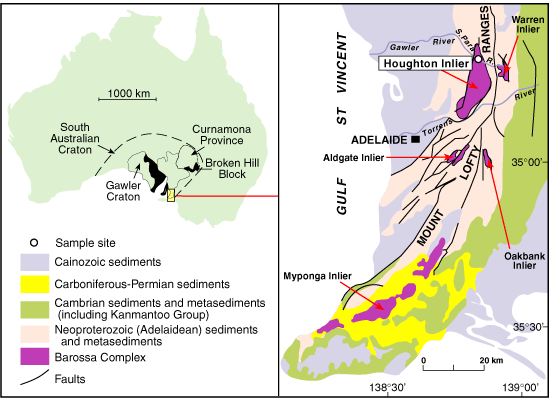
Figure 1. Sketch map of the eastern Gawler Craton, showing the location of the Houghton Inlier and the Curnamona Block.
Similar age populations are also found in zircons from both the Gawler Craton (syn-Kimban intrusives) and the Curnamona Province (lower Willyama Group), and the U-Pb ages alone cannot define the tectonic affinities of the Houghton Inlier. However, the Hf-isotope data on the zircons add another layer of information that can solve the problem (Fig. 4). The zircons of the 1720 Ma and 1630 Ma populations from the Gawler craton show a relatively restricted range of Hf-isotope compositions with low 176Hf/177Hf, reflecting derivation of the 1720 Ma magmas from much older (Archean) crust. In contrast, the corresponding zircons from the Curnamona Province rocks show a wide range of Hf-isotope compositions, extending to quite juvenile values near the Depleted Mantle (DM) line. This range of Hf-isotope compositions reflects both melting of ancient crust, and the input of juvenile material from the mantle, during the 1720 Ma magmatism in the Curnamona Province. The low 176Hf/177Hf of the zircons from the Houghton Inlier shows that they lack the juvenile component and clearly show stronger similarities to the Gawler Craton data.
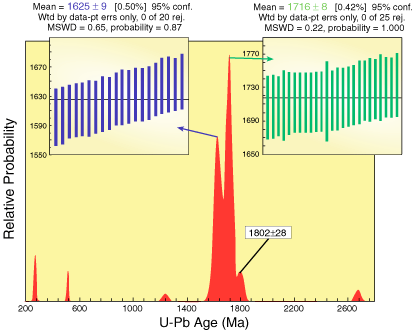 |
Figure 2. Cumulative-probability histogram of U-Pb data (207Pb/206Pb ages) for zircons from the Houghton Inlier (South Para River), showing two age peaks at 1716 ±8 Ma and 1625±9 Ma. |
| Figure 4. Hf-isotope data for zircons with U-Pb ages of ca 1720 Ma and 1630 Ma, from the Houghton Inlier (this work), the Gawler Craton and the Broken Hill area (author's unpublished data). |
 |
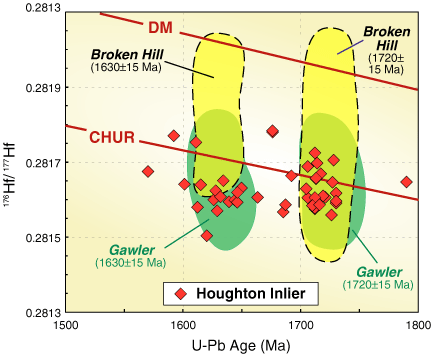 |
Figure 3. Combined cathodoluminescence/ backscattered electron images of zircons from the Houghton Inlier, showing oscillatory-zoned (igneous) cores and structureless (metamorphic) rims. Circles show location of laser-ablation pits; scale bar is 50 microns. |
The zircon data thus indicate that the Houghton Inlier is closely related to the Gawler Craton, while the Curnamona Block has experienced a different type of crustal evolution in mid-Proterozoic time.
Contacts: Elena Belousova, Sue O'Reilly, Bill Griffin
Funded by: ARC APD grant, PIRSA
Following the flow: Thallium isotopes trace subduction processes
One of the fundamental processes of Earth dynamics is the subduction process, in which one tectonic plate is thrust beneath another, and down into the mantle. The subducted plate, consisting of depleted mantle, a basaltic crust derived from it, and a package of overlying sediments, has a very different chemical composition than the deeper mantle. The recycling of this crustal material back into the mantle at subduction zones must have an effect on the geochemistry of the mantle, and these effects must have changed through time.
Subducted material that enters the mantle may be eventually transported back to the Earth's surface via mantle plumes, and ocean-island basalts (OIBs) are generally thought to be the surface expression of such mantle plumes. Earth scientists have therefore long attempted to find evidence that OIBs contain components of either marine sediments or oceanic lithosphere. However, such evidence has proven elusive, probably because the subducted material becomes highly diluted in the deeper mantle and is therefore difficult to detect.
New research has found that the isotopes of thallium (Tl) provide a way to test whether any sediments or ocean crust have contributed to the generation of OIBs. Thallium has two isotopes, 203Tl and 205Tl, and the isotope compositions are measured relative to a standard in parts per 10,000:
ε205Tl = 10,000 x (205Tl/203Tlsample-205Tl/203TlSTD)/(205Tl/203TlSTD)
Even though Tl is one of the heaviest elements in the periodic table, its isotopic composition varies significantly in some environments on Earth. In particular, Tl isotopes are strongly fractionated, and Tl is highly concentrated, in two important subduction components, pelagic sediments and altered oceanic crust. Therefore, this stable isotope tracer is very well suited for studying subduction processes and the recycling of oceanic crust into the mantle via subduction zones. We therefore measured the abundance and isotopic composition of Tl in lavas from Hawaii (a classic OIB locality) in order to determine if the mantle source region of Hawaiian basalts contains traceable amounts of subducted oceanic sediments or lithosphere (Publication #420).
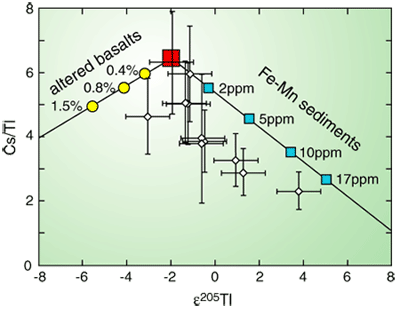 Figure 1. Tl-isotope and Cs/Tl ratios of Hawaiian picrites, showing the negative correlation between Cs/Tl and ε205Tl. Red square shows mean MORB-source-mantle values; blue squares show effect of mixing small amounts of abyssal Fe-Mn sediments into the convecting-mantle source of the picrites; yellow dots show effect of adding altered oceanic basalts to the mantle source.
The Tl isotope compositions of the Hawaiian picrites vary from ε205Tl = -3.1 to +3.8, which means that the most positive values are about 6 ε-units "heavier" than the mantle represented by mid-ocean ridge basalts (MORB; ε205Tl ≈ -2). The Tl isotope compositions display a negative correlation with Cs/Tl ratios (Fig. 1). Thallium and Cs behave similarly in igneous processes and are therefore not expected to fractionate during partial melting or magma differentiation processes. As a consequence, it appears likely that a component with positive ε205Tl and low Cs/Tl contributed to the Hawaiian lavas. The only currently known component that can account for the decreasing Cs/Tl ratios and increasing Tl isotope compositions is ferromanganese marine sediments, which are chemical precipitates that are ubiquitous in the marine environment. The best interpretation of the data therefore appears to involve addition of marine sediments into the mantle source of OIBs, which is consistent with crustal recycling via subduction zones.
Contacts: Sune Nielsen, Bill Griffin
Funded by: PhD support at ETH, GEMOC
How fast does the mantle convect?
The plate tectonics paradigm requires that Earth's mantle convects but it remains difficult to constrain either the plan-form or the rates of mantle flow, since these are not easily observed at the surface. The chemical composition of basaltic lavas erupted from volcanoes provides one of the few direct samplings of the Earths interior. One observation from such data is that rocks less than a few thousand years (kyr) old typically preserve disequilibria between short-lived isotopes of the U-series decay chains, for instance between 238U-230Th (which has a half life of 75 kyr) or between235U and 231Pa (which has a half life of 33 kyr). Mantle melting beneath ridges and intraplate volcanoes occurs primarily due to decompression of upwelling peridotite and the rate of melting is proportional to the rate of upwelling. Numerical models show that the extent of 238U-230Th and 235U and 231Pa disequilibrium is strongly controlled by the rate of melting because this determines the amount of 230Th and 231Pa that are formed by decay of U in the un-melted peridotite residue. 230Th and 231Pa are strongly incompatible in mantle minerals, so these elements are continuously extracted from the peridodite residue and added to the melt. Thus, erupted melts have excesses of 230Th and 231Pa relative to their parental U and the extent of these excesses is proportional to the upwelling rate; this mechanism provides a tool to measure and map mantle upwelling rates. In studies involving Honours student Zoe Demidjuk and Professor Bernard Bourdon at ETH in Zurich, we have used U-series disequilibria to determine the mantle upwelling rate beneath Mount Gambier in South Australia and the Azores archipelago in the mid-Atlantic. The results indicate an upwelling rate of 1-2 cm per year beneath Mount Gambier and 3-4 cm per year beneath the Azores. These slow rates are consistent with the presence of relatively cool mantle plumes beneath these regions, which form part of the return flow that complements the mantle down-welling occurring in subduction zones. In the case of the Azores, the volcanoes are widely enough distributed to permit 3-D imaging of the plan-form of mantle upwelling, and thus to calculate the temperature distribution in the mantle as shown in Figure 1.
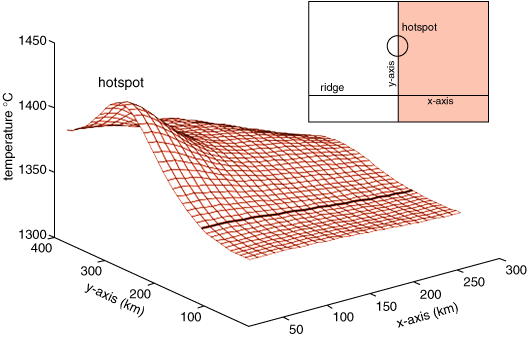
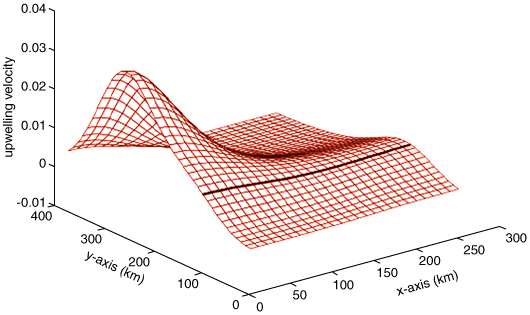
Figure 1. Temperature and upwelling velocity fields for the Azores plume inverted from U-Pa disequilibria data (after Bourdon, B., Turner, S., and Ribe, N.M., 2005. Partial melting and upwelling rates beneath the Azores from a U-series isotope perspective. Earth and Planetary Science Letters 239, 42-56).
Contact: Simon Turner
Funded by: Royal Society of UK, Federation Fellowship
Cold adventures: Measuring ice and the crust in Antarctica
The law dome in wilkes land, East Antarctica, is a roughly spherical ice cap approximately 200km in diameter, with an elevation of approximately 1400 metres at its centre (Fig. 1). It is bounded to the north by the Southern Ocean and the south by the Totten-Vanderford Glacier Trough. This Trough directs ice flow from the East Antarctic Ice Sheet (EAIS) around Law Dome to be expelled at the trough's extremities, the Totten Glacier to the east, and the Vanderford glacier to the west. So the Law Dome can be treated as an individual ice cap; its ice accumulation only depends on local snowfall, and we can use it to develop models of ice cap motion and mass balance for application to larger ice caps such as the EAIS.
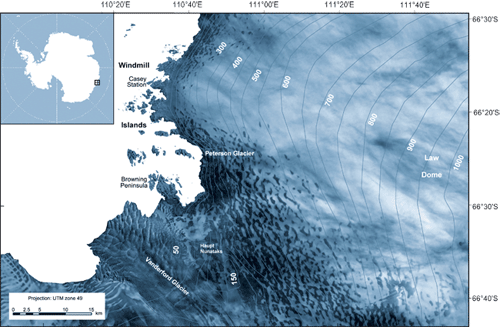
Figure 1. The Windmill Islands on the western edge of the Law Dome ice cap, East Antarctica, at approximately 66°20'S 110°30'E. (Map adapted from the Casey ice runway map provided by the Australian Antarctic Data Centre)
Law Dome has been surveyed for almost 50 years using gravity techniques. During the 2004/05 summer season, we carried out a new gravity survey coupled with terrestrial GPS and satellite measurements. The aim was to determine the effects of climate change on snow surface elevation during the past five decades, by comparing the new data with the older work. A decrease in gravity over most of the survey area is consistent with the increased snow surface elevation deduced from the GPS surveying and ICESAT. The snow surface elevation near the dome summit has increased by approximately 12 cm/yr over the 50 year period, a total of about 6m. This significant increase in elevation indicates positive mass balance in this major part of the ice cap, and probably reflects increased snowfall due to a warmer climate.
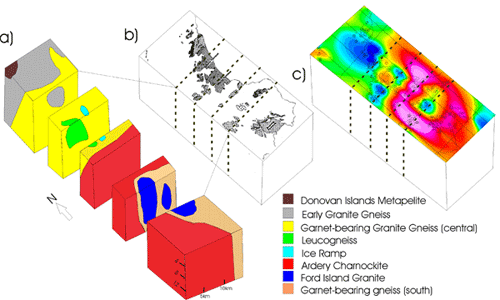
Figure 2. Block model of the Windmill Islands region and subsurface. a) The 3D model sliced along relevant east-west oriented transects to show the depth extents and orientations of the various rock units. There is no vertical exaggeration, so the sections show the true dip of contacts. b) Geology map of the Windmill Islands (from Paul et al., 1995), with dotted black lines representing the slices. c) The Bouguer anomaly map of the Windmill Islands with dotted black lines representing the slices.
The second component of the 2004/05 season was a gravity survey on the Windmill Islands, a group of topographically low islands and peninsulas jutting out from the western margin of Law Dome (Fig. 1). The aims of the survey were to add to the existing gravity dataset and to investigate the sub-surface geology of the Windmill Islands area. Ninety-three gravity stations were established and these data were combined with 43 stations from a 1993/94 survey to allow a complex three-dimensional subsurface model to be constructed (Fig. 2). The Bouguer anomaly image shows a strong correlation with the mapped geology of the region (Fig. 3). An intrusive charnockite unit causes the dominant positive gravity anomaly of the study area and has been modelled as extending to depths of more than 15km with sub-vertical contacts. The charnockite unit surrounds two younger granite plutons, one of which is a blind pluton. The modelling also revealed an ice ramp on the Mitchell Peninsula, defining a would-be island joined to the Law Dome ice cap.
The survey also set the foundation for future time-series gravity work in the Windmill Islands to deduce gravity and rock surface elevation changes as a result of isostatic rebound since the Last Glacial Maximum.
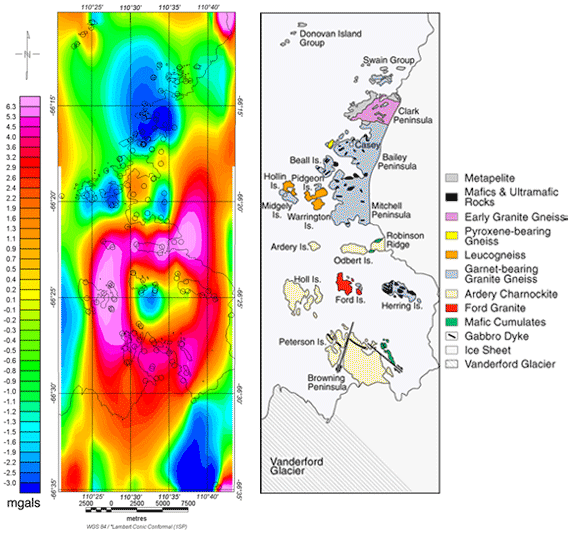
Figure 3. Bouguer gravity image of the merged 1993/94 and 2004/05 Windmill Islands gravity dataset, set alongside a geological map of the area. Correlations between the Bouguer anomalies and major geological units are evident. It can be seen that the dominant high anomaly (shown in red/pink) in the south is produced by the dense Ardery Charnockite unit, surrounding the relative low (in blue) created by the Ford Granite pluton. The ice ramp can be seen as the small low anomaly (blue) at 66°20'S 110°34'E. The Bouguer anomalies in the northern portion of the image are influenced by metamorphic rock units of varying densities, with the low anomaly on Clark Peninsula caused by the less dense Early Granite Gneiss. The small black circles represent gravity station locations.
Taking a gravity measurement on the Law Dome ice cap along side a Hagglunds tracked vehicle.
Contacts: Brad Bailey (pictured above), Mark Lackie (Macquarie University) and Peter Morgan (University of Canberra)
Funded by: ASAC Grant 2580
Erosion in the Murray-Darling basin: how long does it take to produce and transport sediments? By how much has intense land use increased erosion rates?
Erosion is one of the major processes that shape Earth's surface, moving sediments and solutes from the continents to the oceans. Soil erosion has major implications for our society; it can decrease agriculture productivity and affect water quality. Despite its importance, our understanding of the rates of erosion and the transport of sediments is still limited. Only a few attempts have been made to quantify how human disturbance (eg intensive agriculture in SE Australia over the past 100 years) has enhanced erosion. However, the recent development of tools for analysing uranium-series isotopes has made it possible to address these questions quantitatively.
Uranium-series isotopes are nuclides produced in the 238U and 235U decay chains (Fig. 1). Of particular interest are 238U, 234U, 230Th and 226Ra. During chemical weathering, uranium (U) and radium (Ra) are generally more soluble than thorium (Th). Consequently, solutions that have leached soluble elements from rocks (eg soil pore water, river water) will be enriched in U and Ra over Th, leaving the residual products (eg soils, river sediments) depleted in U and Ra. Thus the activity ratios 238U/230Th and 226Ra/230Th will be > 1 in waters and < 1 in sediments and soils. As these isotopes decay, their activity ratios will reflect both the fractionation during weathering and the time since the fractionation occurred. Hence, they can provide time constraints on erosion and weathering processes. The 238U-234U, 234U-230Th and 230Th-226Ra radioactive systems record weathering-related fractionation that occurred up to 1 million years, 300,000 years and 10,000 years ago, respectively; timescales are determined by the daughter half-life of each system. This allows us to tackle erosion issues with a variable time resolution.
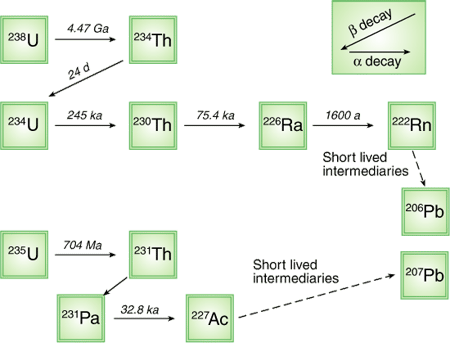
Figure 1. U-series isotopes. Of specific interest here are 234U, 230Th, and 226Ra which have half-lives of 245 000, 75 000 and 1600 years respectively.
At GEMOC, one on-going project focuses on the Murray-Darling basin, which drains most of southeastern Australia. In a novel approach, we measured U-series isotopes in different-sized suspended particles in the river water, to understand what controls the distribution of these isotopes in river systems. This project is a collaboration with Dr Grant Douglas and CSIRO Land and Water, Perth (WA) who provided the samples.
We found that smaller suspended particles adsorb more organic matter, and that this controls the U-series isotopic composition of river colloids and suspended sediments. Using the U-series isotopic composition of these materials, we were able to correct for exchange between organic matter and silicate grains and determine the isotopic signature derived solely from weathering. Assuming that sediments are continuously weathered during their storage in the soil and transport in the river, we could infer that sediments take only ~ 10,000 years to pass through the Murray-Darling basin (Fig. 2). This age coincides with major changes in the conditions of erosion in the basin, and suggests that the U-series isotopic composition of river material records the last major change in erosion conditions, which shaped the current river system.
The U-series isotopic composition of colloids and sediments can also be used to infer long-term erosion rates (in this case, ~ 10,000 years). It turns out that long-term erosion rates are significantly lower than present-day rates measured by sediment gauging (Fig. 2). This implies a recent increase in erosion, which probably is related to the intensification of agriculture over the past 100 years.
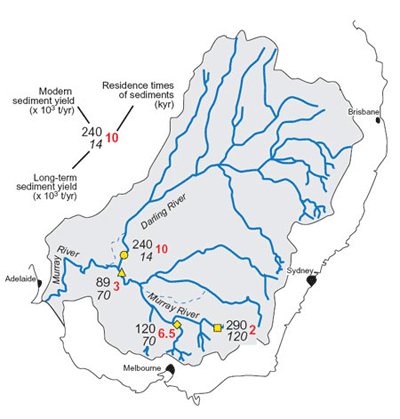 This approach offers a novel method for quantifying the effect of European settlement on erosion rates and to identify the most stressed areas. For instance, the difference between long-term and present-day erosion rates is a factor ~ 2 in the Murray River basin, whereas present erosion rates are about ~ 100 times the long-term rate in the Darling basin. We can vary the spatial resolution of the method by simply sampling rivers that drain catchments of different size. A similar project is currently being conducted in small tropical watersheds of Puerto Rico, characterized by the largest known weathering rates. This project should allow us to understand the dependence of erosion on different climatic conditions (eg semi-arid for the Darling River, tropical for Puerto Rico) and catchment size (1,000,000 km2 for the Murray-Darling basin, ~ 3 km2 for Rio Icacos in Puerto Rico)
(see GEMOC Publication #437).
Figure 2. Modern (plain) and long-term sediment yield inferred from U-series (italics) in the Murray-Darling basin. It can be seen that the greatest increase in erosion rates occurs in the Darling River basin. Sediments have a relatively short residence time (red) related to changes in erosion conditions at different stages of the basin history (11,000 years for the Darling basin; 3000 years for the Murray basin). The difference in residence time between the Murray River at Merbein (3000 years) and Rushy Billabong (2000 years) indicates that the average transport time of sediments between these two locations is 1000 years.
Contacts: Anthony Dosseto and Simon Turner
Funded by: ARC Grant DP0451704
Are all mantle plumes equal in Nickel and PGE potential?
The world's major economic nickel (Ni) - platinum group element (PGE) ore deposits (eg Noril'sk, Siberia) are associated with continental flood basalts (CFBs) of large igneous provinces (LIPs). These LIPs were derived from mantle plumes (rising from the convecting mantle underneath the Earth's lithosphere and possibly as deep as the core-mantle boundary), but not all the CFBs host significant Ni-PGE deposits.
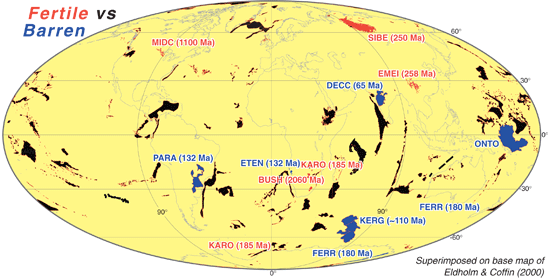
Figure 1. Distribution of fertile (red labels) and barren (blue labels) LIPs, with ages. DECC, Deccan Traps; ONTO, Ontong-Java; FERR, Ferrar; KERG, Kerguelen; ETEN, Etendeka; PARA, Parana; SIBE, Siberian Traps; MIDC, Mid-Continent; KARO, Karoo basalts; EMEI, Emeishan.
Conventional models for igneous Ni-Cu-PGE deposit propose that parental melts for Ni-PGE deposits are generated by large-degree melting of the mantle plume, with almost full dissolution of mantle sulfides, and that Ni-PGE enrichment and mineralisation reflect shallow processes. These models assume that the mantle plume is the ultimate source of Ni and PGE and focus upon processes that operated after the segregation of the magma from the mantle matrix. One implication of these models is that all mantle plumes are born equal in terms of their Ni-PGE-potential. However, detailed geochemical studies of LIPs have indicated that each plume may have a complex history and heterogeneous composition. Therefore, there may be "plumes and plumes", some being predisposed to be favourable for large-scale Ni-PGE mineralisation while others are not.
This project has taken an empirical approach, examining existing geochemical data to see whether there are fundamental geochemical differences between CFBs that are "fertile" and "barren" in terms of their Ni-PGE potential. If such differences exist, favourable geochemical signatures for the basalts with high mineralisation potential can be defined, and the mantle reservoirs and processes that produce magmas with high potential for forming Ni-Cu-PGE deposits can be explored. Geochemical data from 10 LIPs (Fig. 1) have been collected from the literature. The fertile LIPs (Bushveld, Siberia, Midcontinent, Emeishan and Karoo) host magmatic ore deposits of various type, size and grade. They commonly intruded through, or on the edges of, ancient cratonic terranes. In contrast, the "barren" LIPs erupted through both continental and oceanic settings of various ages.
Radiogenic isotopic signatures indicate that the source for almost all LIP magmas is the deep-seated mantle plume source (FOZO), and not the more widespread depleted asthenospheric mantle (MORB) source; this confirms generally accepted models. However, several important chemical characteristics of, "fertile" and "barren" LIPs have been identified.
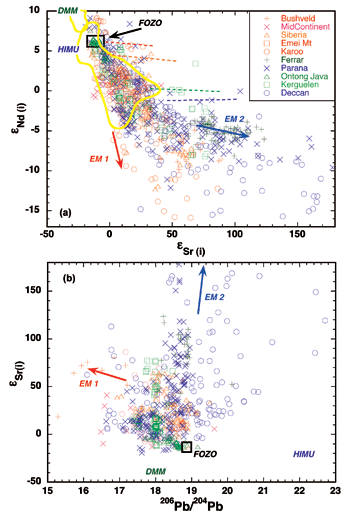 CFBs generated from fertile plumes generally include a relatively high proportion of primitive high-MgO melts that are low in Al2O3 and Na2O, but are highly enriched in strongly incompatible elements (K, P, Ba, Sr, Pb, Th, Nb, LREE) and have elevated K/Ti, Ba/Th and Ba/Nb. They display trends of Sr-Nd-Pb isotopic variation between FOZO and an enriched mantle component (EM1; see Fig. 2). The fertile CFBs also have relatively high Os contents (≥ 0.03 to 5 ppb) and low Re/Os (< 10). In contrast, the barren LIPs contain fewer high-MgO lavas. They have high Rb/Ba ratios and show isotopic signatures of mixing between FOZO and upper continental crust (EM2). The barren LIP lavas in general have low Os contents (mostly ≤ 0.02 ppb) with high Re/Os (10 - ≥ 200).
These chemical signatures suggest that interaction between plume-related magmas and ancient subcontinental lithospheric mantle (SCLM) may play an important role in producing Ni-PGE fertility in LIP magmas, with significant contributions of Ni-PGE from pre-existing Ni- and PGE-rich sulfide phases in the cratonic SCLM. Deep recycled material may be involved in the source of barren LIPs, but they have had low degrees of interaction with old lithospheric roots. This study is continuing, with detailed examination of PGE and Os-isotope systematics.
Figure 2. Isotopic data for fertile and barren LIPs, showing trends between the common mantle-plume source (FOZO) and the EM1(fertile LIPs) and EM2 (barren LIPs) reservoirs.
Contacts: Ming Zhang, Sue O'Reilly, Kuo-Lung Wang
Funded by: Macquarie University, BHP-Billiton
Re-Os isotopes in mantle xenoliths from eastern China: age and evolution of the lithospheric mantle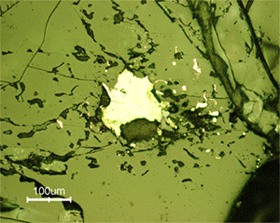
In situ Re-Os isotopic data for sulfide grains in mantle xenoliths from the Cathaysia and Sino-Korean blocks in eastern China (Fig. 2) have been used to constrain the age of the lithospheric mantle, and to investigate the linkage between crustal tectonism and fluid-migration events in the mantle. All of the xenoliths come from Mesozoic to Tertiary basalt localities. Polished sections of many xenoliths from each locality have been searched for sulfide grains; once these were analysed, the samples were polished down again, more grains were analysed, and the process was repeated.
Figure 1. Interstitial sulfide in spinel peridotite xenolith from China.
Many xenoliths contain abundant sulfides of the "interstitial" type, (Fig. 1) which generally have Os contents too low, or Re/Os ratios too high, for reliable in-situ measurement. However, we also have found many grains, both interstitial and enclosed in the silicate phases, that have low Re/Os and enough Os to give results with acceptable precision.
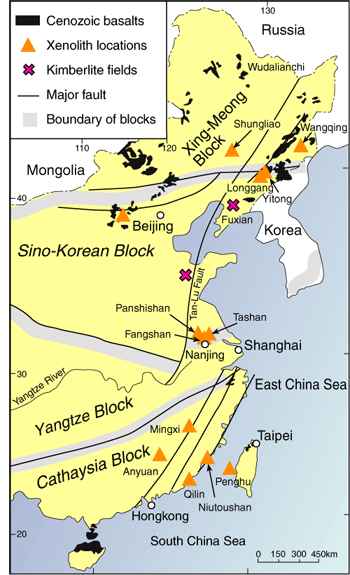
Figure 1. Sample localities.
The samples from the Cathaysia block, whether from the coastal region or inland, show a broad range of ages (Fig. 3) spanning from mid-Proterozoic to Paleozoic; the inland samples also show an age peak in Mesozoic time, corresponding roughly to the widespread Yanshanian magmatic event. The samples from the Sino-Korean Craton also show a wide range of ages from mid-Proterozoic onwards (Fig. 4).
The Re-Os data generally reflect the presence and modification of Proterozoic lithospheric mantle. These ages are consistent with the age of the overlying crustal basement in the Cathaysia block. However, the Sino-Korean block has generally younger lithospheric mantle underlying the Archean crustal basement. Archean Re-Os ages have been measured on mantle xenoliths from the Ordovician kimberlites at Mengyin and Fuxian (Gao et al., 2002), but none have been found in the spinel-peridotite xenoliths from Tertiary basalts. A major change in lithosphere thickness, thermal state and composition beneath the eastern half of the Sino-Korean Craton has been defined by comparison of the mantle sampled by the Ordovician kimberlites and the Tertiary basalts. Although most studies have concluded that this major modification of the lithospheric mantle occurred during Mesozoic to Tertiary time, the widespread occurrence of Proterozoic Os model ages may indicate that a major change occurred in Proterozoic time. This may have affected much of the eastern half of the craton, and coincided with tectonic activity along the major suture (the Taihang Rift Zone) between the eastern and western halves of the craton. The original Archean root of the craton may have survived only in the easternmost part, where kimberlites later intruded. Much work remains to be done, but it already is clear that the lithospheric mantle beneath eastern China has had a very complex history, and is now a mixture of refractory and fertile mantle with different ages.
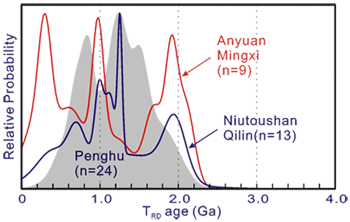
Figure 3. Distribution of model ages for low-Re/Os sulfides in xenoliths from the Cathaysia block. Penghu data are from Wang et al. (2004).
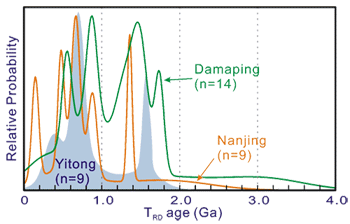
Figure 4. Distribution of model ages for low-Re/Os sulfides in xenoliths from the Cathaysia block.
Contacts: Xisheng Xu, Sue O'Reilly
Funded by: ARC Discovery Project, Linkage International

 GEMOC ARC National Key Centre