Pearson, N.J.1, Griffin, W.L.1,2, Kaminsky, F.V.3,van Achterbergh, E.1 and O'Reilly, S.Y.1
2. CSIRO Exploration and Mining, PO Box 126, North Ryde, NSW 2113, Australia
3. KM Diamond Exploration Ltd, 815 Evelyn Drive, West Vancouver, BC V7T 1J1, Canada
In-situ quantitative analysis by Laser Ablation Microprobe (LAM) ICP-MS has rapidly developed into one of the most powerful analytical techniques in geochemistry, capable of producing high precision determinations of trace elements at sub-ppm detection limits. The laser ablation system at Macquarie University was designed and installed by Drs Simon Jackson and Henry Longerich of Memorial University, Newfoundland. This system includes a Continuum Surelite I-20 Q-switched Nd-YAG laser with a fundamental wavelength of 1064 nm (IR) and frequency doubling crystals which produce 532 nm (visible) and 266 nm (UV) wavelengths. Operation in the UV wavelength produces enhanced ablation yields for materials with low abundances of transition elements. Typical operating conditions for the quantitative analysis of the garnets in this study involved energies of 0.5 to 2 mJ per pulse at a repetition rate of 4 Hz. Under these conditions the pit size produced is between 30 to 60 µm in diameter and the drill rate is approximately 0.5 µm/sec. Ablation times of up to 120 secs were achieved in 0.5 mm. A full description of the LAM instrumentaion and ICP-MS operating conditions is given in Norman et al. (1996). A suite of 20 to 30 minor and trace elements was determined in each analysis and Ca was used as the internal standard in the quantification procedure. Detection limits for all elements in this study are typically in the range 100 ppb to 1 ppm, although actual values for individual analyses will depend on ablation time, which is largely a function of grain size, and on the internal standard concentration.
Sub-calcic and lherzolitic Cr-pyropes in concentrates from several different cratons were analysed: Kaapvaal craton (Newlands, Leicester, Uintjiesberg, Liqhobong); Siberian craton (Sytkanskaya); Slave craton (A-10). The garnet inclusions in diamond are also derived from kimberlites of equal geographical diversity: Yakutia; Venezuela; Ghana; Canada. Our diamond inclusion data are supplemented by ion probe analyses of diamond inclusion garnets from southern Africa and Siberia (Yakutia) from Shimizu and Richardson (1987 and Shimizu and Sobolev (1995). Shimizu and Sobolev did not report Sc data, so we have assumed a value of 130 ppm, equal to the average of the other diamond inclusion peridotite group garnets.
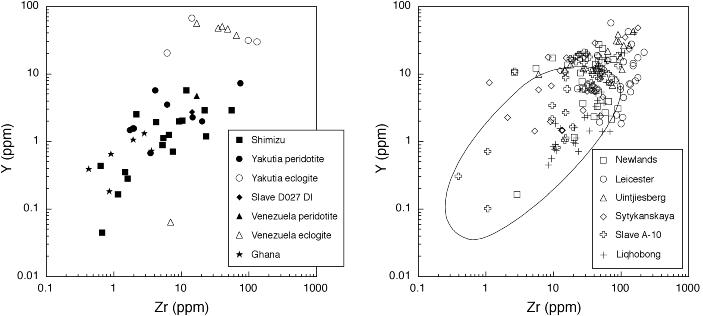
The relationships between elements such as Zr, Y and Ti were used by Griffin and Ryan (1995) to identify the chemical signatures of different types of mantle processes. Plots of these elements in the concentrate and diamond inclusion garnets in this study confirm previous observations that garnet inclusions in diamonds have depleted trace element patterns (Fig. 1; Griffin et al., 1992; Griffin et al., 1993). The majority of diamond inclusion garnets have Zr contents <20 ppm, Y < 8 ppm and Ti from 10 to 2000 ppm. A significant proportion of the garnets from the more diamondiferous pipes (Liqhobong, Newlands; Sytkanskaya) fall within the field defined by the diamond inclusion garnets. Conversely, garnets from the barren kimberlites (Uintjiesberg) plot outside the field of diamond inclusions on these diagrams (Fig. 2).
| Fig 1. Zr vs Y (ppm) for diamond inclusion garnets. |
Fig 2. Zr vs Y (ppm) for Cr-pyrope garnet in concentrate from kimberlite pipes. The field defined by peridotitic garnet inclusions in diamond is drawn from Fig. 1. |

|
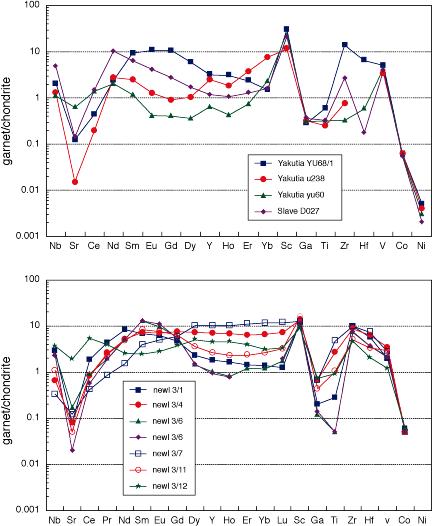
Fig. 3 Chondrite normalised plot of
selected peridotitic garnet inclusions in diamond from Yakutia and Slave
D027.
Fig.4 Chondrite normalised plot of selected peridotitic garnet in concentrate from Newlands kimberlite. |
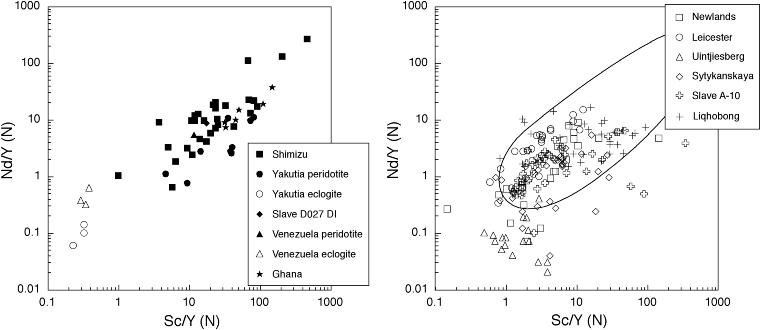
| Fig 5. Sc/Y (N) vs Nd/Y (N)) for diamond inclusion garnets. |
Fig 6. Sc/Y (N) vs Nd/Y (N)) for Cr-pyrope garnet in concentrate from kimberlite pipes. The field defined by peridotitic garnet inclusions in diamond is drawn from Fig. 5. |
The significance of the range in the shapes of these patterns is evident in the plots of Nd/Y(N) versus Sc/Y (N) (Fig. 5 and Fig. 6). The Nd/Y ratio clearly distinguishes garnets with the sinuous REE pattern (Nd/Y >>1) from those with more typical LREE depleted patterns (Nd/Y <<1). Sc contents in Cr-pyrope garnet fall within a very restricted range (100-150 ppm) and because Sc appears to be preferentially accommodated into garnet during depletion, Sc/Y provides a measure of the depletion of HREE. Values of Sc/Y >>1 are indicative of the depleted compositions, whereas Sc/Y ~1 are obtained from undepleted lherzolitic garnets. The quadrant defined by Nd/Y >1 and Sc/Y >1 contains all of the diamond inclusion garnets and a significant number of garnets from the diamondiferous pipes. This plot and a plot of Zr/Y (N) versus Sc/Y (N) (not shown here) provide examples of the simple discrimination tests using the expanded trace element suite to estimate the diamond potential of a pipe. Diamondiferous pipes such as Sytykanskaya, Liqhobong, Newlands and Slave have up to 70% of the Cr-pyrope garnets plotting in the field defined by the diamond inclusions. In the low-grade Leicester pipe the proportion of concentrate diamonds in the diamond inclusion field is < 50%, and in the barren Uintjiesberg pipe the proportion is nil.
References
Griffin, W.L. and Ryan, C.G., 1995. J. Geochem. Explor., 53, 311-337.
Griffin, W.L., Gurney, J.J. and Ryan, C.G., 1992. Contrib. Mineral. Petrol., 110, 1-15.
Griffin, W.L., Sobolev, N.V., Ryan, C.G., Pokhilenko, N.P., Win, T.T. and Yefimov, Y., 1993. Lithos, 29, 235-256
Norman, M.D., Pearson, N.J., Sharma, A. and Griffin, W.L., 1996. Geostandards Newsletter, 20, 247-261.
Shimizu, N. and Richardson, S., 1987. Geochim. Cosmochim. Acta, 51, 755-758.
Shimizu, N. and Sobolev, N.V., 1995. Nature, 375, 394-397.

 GEMOC ARC National Key Centre
