 GEMOC ARC National Key Centre
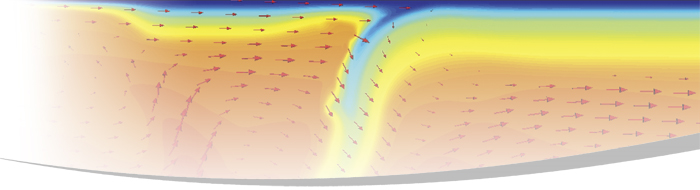
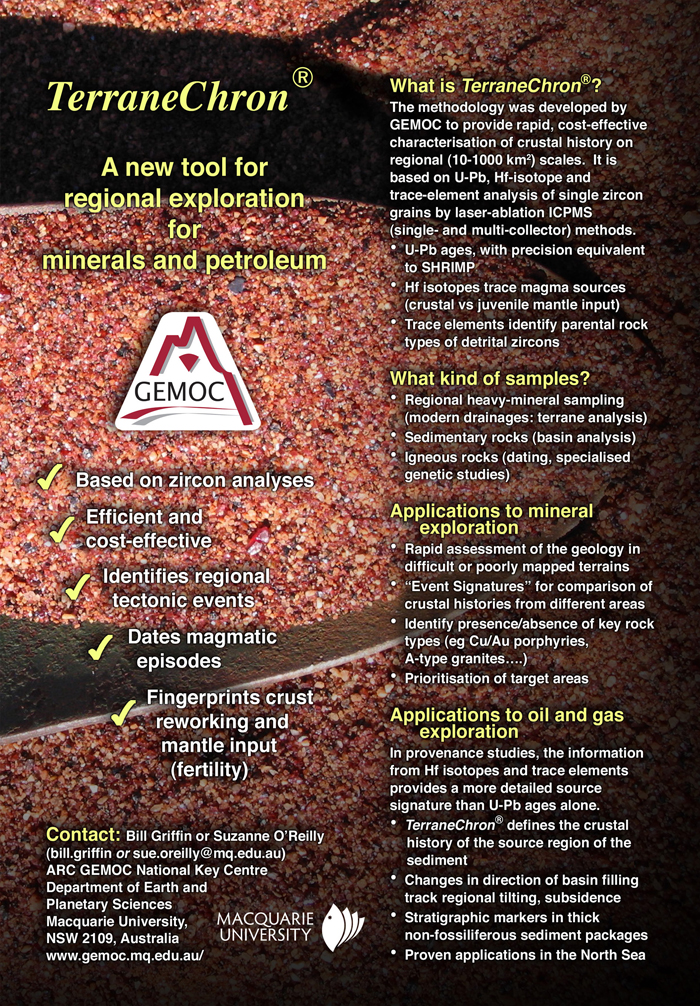
TerraneChron®
TerraneChron® is GEMOC's unique methodology for terrane evaluation. During 2010 a range of new studies, including collaborative research projects with industry, using TerraneChron® expanded our knowledge of crustal evolution and the timing of tectonic events.
When the Earth moves: Applications to geothermal exploration (Western USA)
Seismic waves are the main tool used to reveal information about the underground structure of the Earth, because they can penetrate into the deep interior and be received by seismographs. Seismic tomography is a technique for constructing three dimensional structure of the Earth's interior using these waves. It is analgous to the CT scanning used in medicine to look inside our bodies. Traditional seismic tomography uses natural earthquakes as sources to image internal structure. However, earthquakes are mainly located at tectonic plate boundaries, and this makes it difficult to image the shallow structure of the crust, especially in the top 10 km of the Earth, in aseismic regions such as the Australian continent. The advent of ambient noise tomography in 2005 revolutionised seismic tomography. This new method uses the microseismic noise produced by ubiquitous minor ground motions, the so-called ambient noise, to map seismic velocity along the path between any two seismic stations, independently of earthquakes. It is especially useful for imaging the shallow levels of the crust, where the most abundant natural resources are located, such as mineral deposits, oil and gas reservoirs, and geothermal fields.
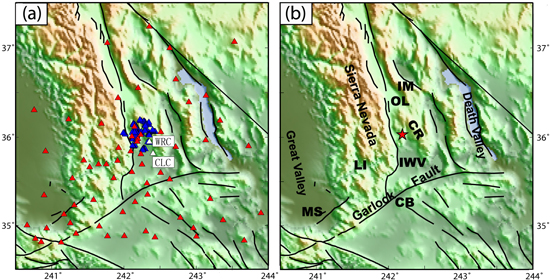
Figure 1. (a) Distribution of seismic stations (triangles) in the Coso Geothermal Area and surrounding areas used in this study. Black lines denote faults. (b) Place names mentioned in text: CB: Cantil Basin; CR: Coso Range; IM: Inyo Mountains; IWV: Indian Wells Valley; LI: Lake Isabella; MS: Maricopa sub-basin; OL: Owens Lake.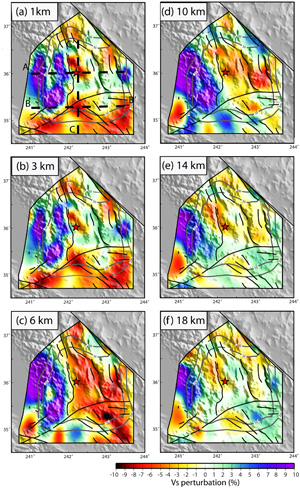
The Coso Geothermal Area lies at the southwestern corner of the actively deforming part of the Basin and Range Province of North America; it is within the Eastern California Shear Zone (Fig. 1). It also lies in the part of the Basin and Range that has experienced the most recent significant volcanism. The Coso Range contains one of the young magmatic centres along the western margin of the Basin and Range; its activity started about 4 Ma ago but entered a phase of bimodal volcanism about 1 Ma ago. The recent magmatic activity produced high temperatures beneath the Coso Geothermal Area, and commercial power development began there in the 1980s. The power plants are currently producing 270 MW from four geothermal power plants. To characterise the geothermal resource and generate electricity more efficiently in the future, numerous geophysical studies have been carried out over the geothermal field. However, two main questions still remain: the depth of the magma chamber acting as the heat source and the relationship of magmatism to faulting or shearing at depth.
Figure 2. Maps of shear velocity at depths of 1, 3, 6, 10, 14 and 18 km, plotted as perturbations to averages at each depth: 1 km (2.867 km/s), 3 km (3.174 km/s), 6 km (3.319 km/s), 10 km (3.452 km/s), 14 km (3.524 km/s), 18 km (3.574 km/s). Two grey contours of resolution at scales of 50 and 200 km are plotted in each map. The three dashed lines in Fig. 2a show the surface locations of the three vertical transects shown in Fig. 3.
In this study, ambient noise tomography was adopted to image shallow structures beneath the Coso Geothermal Area and surrounding areas using all the stations nearby (Fig. 1; see GEMOC Publication #702). The purpose was to constrain the depth of any magma chambers underlying the area. The resulting 3D shear-velocity structure from this study is shown as maps of shear velocities at depths of 1, 3, 6, 10, 14 and 18 km (Fig. 2) and three vertical shear-velocity transects whose surficial positions are indicated in Figure 2a. Warm colors in these figures represent lower seismic velocities, indicating either high temperature or the presence of magma; cold colors represent higher seismic velocities indicating lower temperature.
Low velocities in the entire depth column beneath the Coso Range 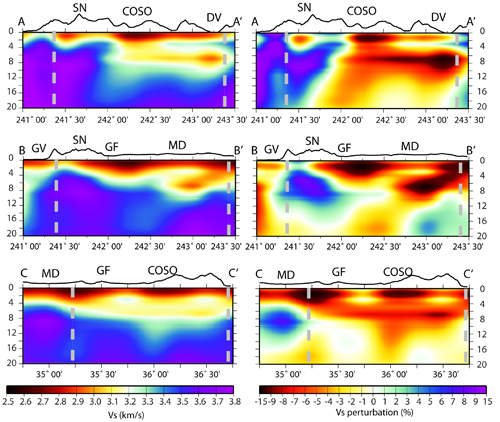 are quite close to the position of the Coso Geothermal Field (Fig. 3). In particular, a feature with very low velocity is imaged in the top 2 km. The appearance of this anomaly, even though the dominant surface exposures are granite, suggests profound alteration of the crust in the area and/or significant influence from shallow magmatic or hydrothermal fluids. Although the entire crustal column beneath the Coso Geothermal Area appears to have depressed Vs speeds (Fig. 3), there is an indication of a stronger low-velocity zone between depths of 6 and 8 km. This may reflect a deeper magmatic anomaly underlying the shallow geothermally-induced anomaly in the top 2 km. The absence of really low velocities below ~14 km (Fig. 2e) tends to support a shallow-magma interpretation.
Figure 3. Vertical transects of shear velocities plotted both as absolute values (left) and as perturbations relative to the 1D Vs averages (right). The two dashed gray lines in each plot enclose an area where the imaging has a lateral resolution of 50 km. The locations of the cross-sections are shown in Fig. 2a. Abbreviations: COSO: the Coso Geothermal Area; SN: the Sierra Nevada Mountains; DV: Death Valley; MD: the Mojave Desert; GV: California's Great Valley; GF: the Garlock Fault.
An intriguing feature that emerges in this study is the low velocities between about 6 and 8 km depth under much, but not all, of the Basin and Range Province (Fig. 2c, 3). This feature correlates well with the extent of sizeable exposures of Neogene and Quaternary volcanic rocks (Fig. 4), strongly suggesting a magmatic origin. Within the area well-resolved by this study, only the older Miocene volcanic centre in the southern Sierra Nevada and some small centres in the eastern Sierra Nevada remain outside this zone. It is implausible that this entire feature represents uniformly distributed melt at these depths, but local accumulations of melt seem consistent with very low electrical resistivity found near these depths north of Coso. This anomaly probably represents crust profoundly reworked by igneous processes over the past few million years. The modern low velocities may represent some combination of melt, alteration, magmatic fluids and high temperatures.
In summary, beneath the Coso Geothermal Area, shear velocities are generally depressed. A prominent low-velocity anomaly is resolved clearly within the top 2 km, probably resulting from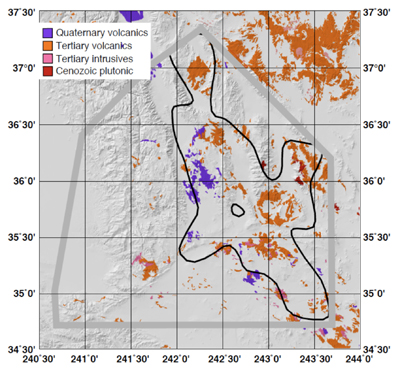 geothermal alteration at shallow depths. The low-velocity anomaly between 6 and 12 km indicates the location of a magmatic body. No magmatic body is imaged below 14 km depth. Low velocities in the broad regions surrounding Coso at depths near 7 km underlie areas with Miocene to recent volcanism. This project has proven the usefulness of ambient-noise tomography for geothermal exploration; the method can be also applied anywhere in Australia in the future to investigate the underground structures relevant to geothermal energy exploration.
Figure 4. Exposures of Cenozoic igneous rocks in eastern California compared with outline (black) of low Vs (<~3% at 6 km depth, Fig. 2c). The extent of the inverted region is shown by the grey outline.
Contact: Yingjie Yang
Funded by: Macquarie CoRE funding
Continents can't subduct!... or can they?
We commonly assume that continental crust cannot be subducted to significant depths, due to its high relative buoyancy. However, clear field and petrological evidence shows that relatively large sections of continental crust have been subducted to depths >100 km and then exhumed, at numerous locations worldwide. The discovery of metamorphic diamonds (Kokchetav massif, Russia; Western Norway…) and especially of pyroxene exsolution in garnets (e.g. Western Norway, Sulu metamorphic belt (China)) further demonstrated the possibility of ultra-deep subduction of continental crust to depths >250 km. The possibility of continental material being subducted to depths of the transition zone, and perhaps even into the lower mantle, is supported by geochemical and isotopic signatures in magmas erupted in island arcs, presumably from source regions at depths >300 km, and by experimental data at extremely high pressures. These studies indicate there may be a "depth of no return" for continentally-derived materials at around 8.5–9 GPa (270 km), where dense silicates start to form. However, the actual amount of continental material that can be subducted below the point of no return, and its final fate, have never been assessed with coupled thermomechanical-thermodynamic numerical models. This is the objective of an ongoing GEMOC research project (for more details see GEMOC Publication #659).
To allow direct comparisons with geological, geochemical and geophysical evidence, numerical simulations need to include realistic thermophysical properties for all the materials involved in the model. Therefore we couple our thermo-mechanical solvers with thermodynamic datasets that account for all expected metamorphic reactions and phase changes. Earlier models made use of thermodynamic databases strictly suitable only at pressures <3 GPa, while we use an in-house database valid up to ~25 GPa that includes all major phases obtained in UHP experiments on compositions relevant to the continental crust. Importantly, we have not imposed velocity boundary conditions to either force or stop continental subduction, so the velocities obtained in our simulations emerge self-consistently from the balance between internal forces in our numerical domain.
We have run a total of 80 simulations (Fig. 1) to test different aspects of the problem (effects of compositional variations in the mantle, passive-margin geometries, types of continental sediments, etc.). The main results can be summarised as follows:
(1) The buoyancy increase due to subduction of continental material may not be the only explanation for the typical decrease in convergence velocity observed in collisional settings after the continental crust arrives at the trench. Delamination of the lithospheric mantle at lower crust levels after a period of continental subduction can result in a similar pattern of convergence velocities. This scenario is favoured in settings dominated by slab rollback.
(2) The thermal structures of the continental plate and passive margin play important roles in the evolution and final configuration of the collision. The colder temperatures in a thick continental plate give it an extra strength, which overcomes the effects of its negative buoyancy. Thus, the overall effect of increasing the thermal thickness of the continental plate is to reduce convergence velocities, stalling subduction and impeding deep recycling of continental material.
(3) When both the arc and the continental plate are free to move (e.g. bounded by mid-ocean ridges), the system evolves as forward subduction rather than as slab rollback. Although the circulation patterns in the sublithospheric mantle and in the mantle wedge are significantly different in these two cases, the general pattern and absolute values of the resulting convergence velocities are similar. Replenishment of fertile mantle in the mantle wedge and enhanced partial melting are favoured in forward-subduction scenarios.
(4) The composition of the continental lithospheric mantle exerts a moderate influence on the overall evolution of the collision system. Since the highly depleted part of the continental mantle seems to be restricted to shallow depths (<60–80 km), the thermal effect is usually more important and the overall buoyancy of the lithospheric mantle at the beginning of the collision is negative.
(5) The rheology of the continental crust is a major factor controlling both the duration of continental subduction and the volume of continental material that can be subducted. Strong crusts favour deep subduction of continental materials while soft crusts tend to accumulate at shallow depths. In the latter case, the decoupling between the upper crust and the rest of the lithosphere effectively restricts the increase in the positive buoyancy of the slab, which remains negatively buoyant at all conditions.
(6) Subducted continental crust remains buoyant with respect to the surrounding mantle down to depths of ~250–300 km. Potential detachments from the slab will therefore result in upwelling of these continental portions. However, the characteristic cold temperatures in the uppermost part of the slab result in a strong mechanical coupling between the crustal and mantle components, making detachment more difficult.
(7) Subducted continental crust that reaches depths >250–300 km becomes significantly denser than the surrounding mantle, due to the appearance of high-density phases. This provides extra negative buoyancy to the slab and inhibits the return of subducted crust to the surface (the point of no return).
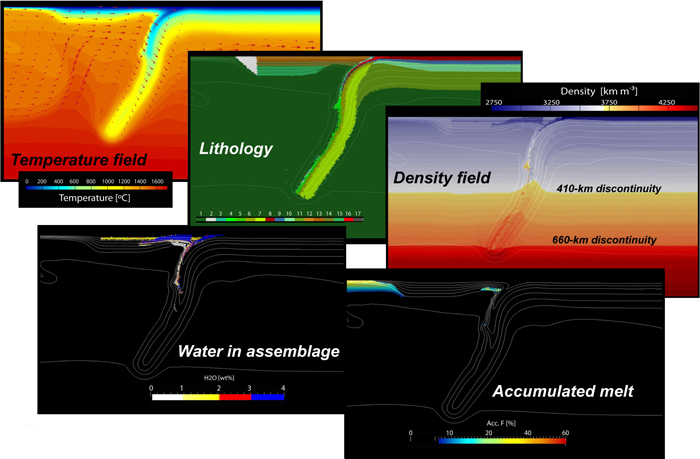
Figure 1. Snapshot from one of our simulations showing the thermal, density and compositional fields. The amount of bound water in the assemblages and accumulated melting in the mantle are also shown. The simulations were carried out with a modified version of the Underworld platform (http://www.underworldproject.org).
Contact: Juan Carlos Afonso
Funded by: Macquarie CoRE Funding
The Lithosphere-Asthenosphere boundary: Can we sample it?
The lithosphere-asthenosphere boundary (LAB) represents the base of the Earth's lithosphere, the rigid and relatively cool outer shell characterised by a conductive thermal regime, and isolated fro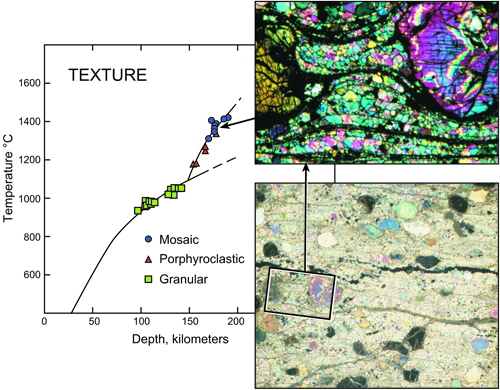 m the convecting asthenosphere. Chemically, the LAB should divide a lithospheric mantle that is variably depleted in basaltic components from a more fertile asthenosphere.
Figure 1. The original Lesotho xenolith geotherm of Boyd and Nixon (1975) showing the conductive low-T limb defined by granular-structured garnet lherzolites and the "kinked" limb defined by high-T sheared peridotites such as PHN1611 (photomicrographs). Base of upper photomicrograph is 0.5 mm.
In xenolith suites from cratonic areas, the bottom of the depleted lithosphere is marked by a rapid downward increase in elements such as Fe, Ca, Al, Ti, Zr and Y, and a rapid decrease in the median Mg# of olivine (Figs. 1,2), reflecting the infiltration of mafic melts and related fluids (GEMOC Publication #650). Eclogites and related mafic and carbonatitic crystallisation products are concentrated at the same depths as the maximum degrees of metasomatism (Fig. 3), and may represent the melts responsible for the refertilisation of the basal lithosphere. This refertilised zone, which lies at depths of ca
170-220 km beneath Archean and Proterozoic cratons, is unlikely to represent a true LAB (GEMOC Publication #576; http:// www.mantleplumes.org/LithosphereRemnants.html). 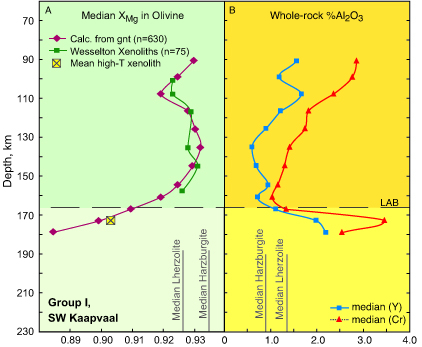
Re-Os isotopic studies of the deepest fertile peridotite xenoliths show that they retain evidence of ancient depletion events; seismic tomography data show high-velocity material extending to much greater depths beneath cratons. The cratonic "LAB" probably represents a level where asthenospheric melts have ponded and refertilised the lithosphere, rather than marking a transition to the convecting asthenosphere. Our only deeper samples are rare diamond inclusions and some xenoliths inverted from majoritic garnet, which are unlikely to represent the bulk composition of the asthenosphere.
Figure 2. Geochemical parameters that can be derived from the compositions of xenocrystic peridotitic garnets. (A) XMg
of coexisting olivine vs depth (GEMOC Publication #222) (B) Median whole-rock Al2O3 contents vs depth in the same kimberlites (GEMOC Publication #132).
In younger continental regions the lithosphere-asthenosphere boundary is shallower (commonly at about 80–100 km) and more clearly marked. In regions of extension and lithosphere thinning (e.g. eastern China, eastern Australia, Mongolia), upwelling asthenosphere may cool to form the lowermost lithosphere, and may be represented by xenoliths of fertile garnet peridotites in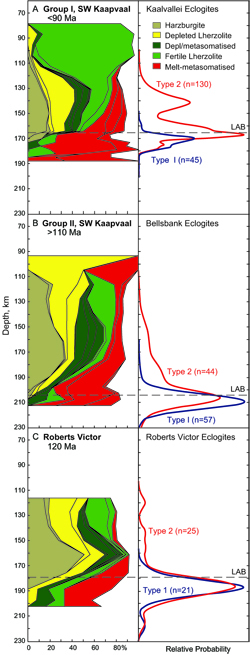 alkali basalts worldwide. It has also been shown experimentally that the LAB beneath cratons is coincident with the depth where the mantle solidus is exceeded for some compositions, and this is the level where segregation of carbonate-rich fluids can occur (e.g. Wyllie, JGR 85, 1988; Gudfinnsson and Presnall, JGR 101, 1996). The presence of carbonate-rich fluids, in addition to mafic melts, at this level provides a possible explanation for the magnetotelluric signals that suggest the LAB may be detected by lower resistivity (Jones et al., Lithos 120, 2010). Gaillard et al. (Science 322, 2008) demonstrated that carbonate melts are much more highly conductive than silicate melts, and that small amounts of carbonate melt will wet grain boundaries, providing a physical-chemical basis for the magnetotelluric signals at these depths.
Figure 3. Distribution of eclogites in representative mantle sections.
(Data from GEMOC Publication #461)
The increased conductivity commonly observed at about 90 km in young tectonic lithospheric regions and from about 180 to 220 km in cratonic regions also may coincide with the level at which fluids may segregate because there is a sharp drop in the water-storage capacity of mantle wall rocks, coupled with the onset of small degrees of partial melting in the presence of water (e.g. Green et al., Nature 467, 2010).
The LAB is a movable boundary. It may become shallower due to thermal and chemical erosion of the lithosphere, assisted by extension (Fig. 4). Refertilised lithospheric sections, especially where peridotites are intermixed with eclogite, may be subject to gravitational delamination. The lithosphere-asthenosphere boundary may also be deepened by subcretion of upwelling hot mantle (e.g. plumes). This process may be recorded in the strongly layered lithospheric mantle sections seen in the Slave Craton (Canada), northern Michigan (USA) and the Gawler Craton (Australia).
Contacts: Sue O'Reilly and Bill Griffin
Funded by: ARC Discovery Project and Linkage Grants, BHP-Billiton, MQ PhD Scholarships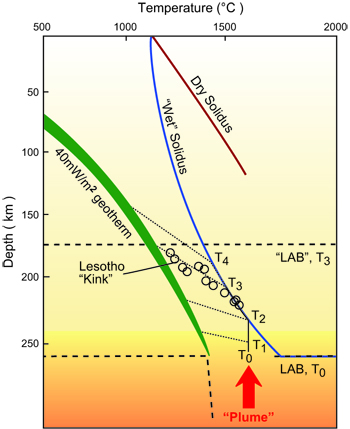
Figure 4. Development of a kinked geotherm by impingement of a thermal pulse on the base of the lithosphere; the accompanying refertilisation front moves up through the lithosphere to establish a new "LAB" and a (temporarily) kinked geotherm.
Out of Africa: Garnets reveal insights into Earth's oldest mantle
Most of our knowledge about the composition, structure, thermal state and processes in the subcontinental lithospheric mantle (SCLM) has been obtained by analysing mantle-derived xenoliths and xenocrysts, brought to the Earth's surface in volcanic rocks such as kimberlites. Xenolith studies are often costly and time consuming, and it is often difficult to obtain enough samples for a statistically representative xenolith suite. A more accessible source of information is the xenocrysts derived from the disaggregation of mantle xenoliths. As xenocrysts are far more abundant than xenoliths, they are useful in characterising the SCLM sampled by kimberlites that lack mantle xenoliths.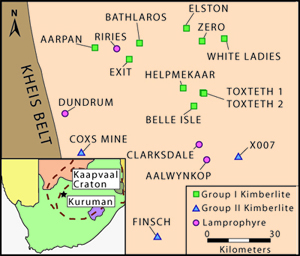
Figure 1. Location and classification of intrusions in the Kuruman Province of South Africa.
Pyrope garnet xenocrysts are particularly useful, because the Ni and Cr contents in some garnets can be used to estimate equilibrium temperature (TNi) and pressure (PCr) conditions and these P-T data can be used to construct a geotherm. With this framework, the Ni contents of other garnets can give a T, and projection of the T to the geotherm gives a depth estimate for the individual grains. The Y content of garnets can be used to estimate the depth of the lithosphere-asthenosphere boundary (LAB), as low-Y garnets (< 10 ppm) are restricted to the lithosphere. Furthermore, the trace-element (i.e. Zr, Y, Ga and Ti) contents in garnets can be used to identify different types of metasomatism that affected the SCLM where the garnets were derived. Garnets can be subdivided, based on inter-element correlations, into five groups: depleted harzburgites, depleted lherzolites, depleted/metasomatised lherzolites, fertile lherzolites and melt-metasomatised peridotites (GEMOC Publication #299). The proportion of garnets from these five categories can then be mapped as a function of depth, to construct "chemical tomography" sections that show geochemical variation with depth in the lithospheric section.
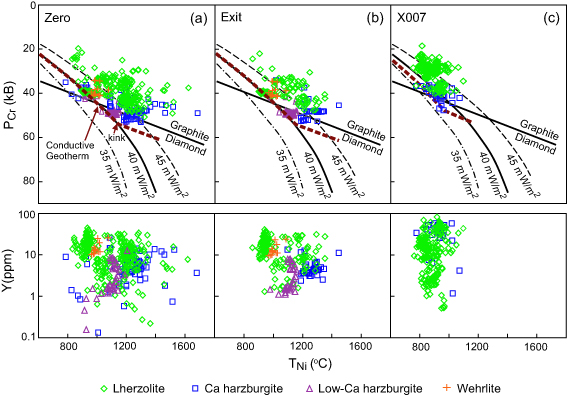
Figure 2. Conductive geotherms from the (a) Proterozoic Zero kimberlite, (b) Proterozoic Exit kimberlite, and (c) Cretaceous X007 orangeite. Note the higher 40mW/m2 geotherm for the kimberlites relative to the younger orangeite intrusion.
The Kuruman Kimberlite Province (Fig. 1) lies on the western margin of the Kaapvaal Craton and contains some of the oldest known kimberlites (~1.6 to 1.8 Ga; Shee et al., 1989, Proc. 4th Int. Kimb. Conf. p 60-82; GEMOC Publication #662). While most kimberlites intrude through SCLM that has undergone many episodes of metasomatism (GEMOC Publication #449; Foley, 2008, Nature Geoscience, 1, 503-510), the Kuruman Province may provide a unique opportunity to examine a relatively undisturbed section of the SCLM. This study utilised the major- and trace-element compositions of mantle-derived garnets from Kuruman intrusions, which represent two distinct geochronological and petrogenetic groups, namely Proterozoic kimberlites and Cretaceous orangeite. The data provided several key observations:
(1) The Proterozoic kimberlites sampled SCLM with low conductive geotherms (~40 mW/m2; Fig. 2a,b), but these were thermally disturbed at shallow depths, consistent with the lack of diamonds in these kimberlites.
(2) The Proterozoic kimberlites sampled a lithospheric thickness of ~170 km, while the X007 Cretaceous orangeite sampled a thinner (~145 km) SCLM that had a lower conductive geotherm (~37.5 mW/m2; Fig. 2c).
(3) Chemical tomography (Fig. 3) reveals that the SCLM sampled by the Proterozoic kimberlites (i) was highly depleted; (ii) had experienced extensive phlogopite-related metasomatism; and (iii) had not experienced significant melt-related metasomatism, even at great depths.
(4) The SCLM sampled by the Cretaceous X007 orangeite contained much less harzburgite and had experienced more extensive metasomatic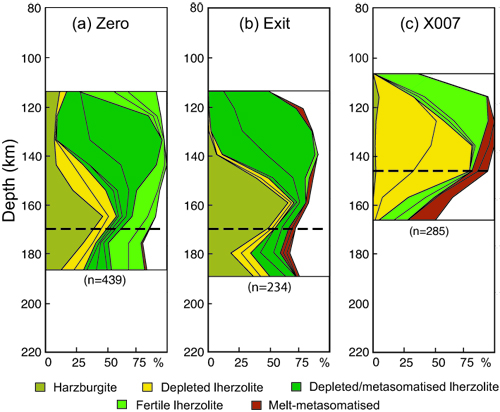 modification, producing more abundant lherzolites.
These observations are consistent with the concept of the secular chemical evolution of the SCLM, whereby older depleted lithosphere is progressively refertilised by asthenospheric-derived melts over time (GEMOC Publication #303). As such, the Proterozoic Kuruman kimberlites provide an excellent example of relatively unmodified ancient SCLM and represent an important, rarely observed, point of reference for the chemical evolution of the SCLM.
Contacts: Cara Donnelly, Bill Griffin
Funded by: ARC Discovery Project Grant and Linkage, iMURS, PGRF
Figure 3. SCLM chemical tomography for the (a) Proterozoic Zero kimberlite, (b) Proterozoic Exit kimberlite, and (c) Cretaceous X007 orangeite. Note the more fertile compositions and shallower LAB (derived from Y contents in garnet) of the younger X007 orangeite, relative to the kimberlites.
What's new? - TerraneChron? pinpoints when and where continental crust really grew
The continental crust is an "end product" of the chemical differentiation of the Earth's primitive mantle through time; the question of crustal growth rate thus bears directly on the nature and timing of this differentiation process. It is not enough to just measure the relative volumes of crust with known ages, because some of the crust may be juvenile (i.e. derived from the convecting mantle), while other parts may be derived by recycling older crust. To understand the growth of the crust through time, we need to determine the sources of the magmatic rocks that went into making the crust: do these represent juvenile additions, or recycling, or perhaps the mixing of juvenile and recycled material? The U-Pb and Lu-Hf isotope systems in zircon give us a powerful tool for answering questions like this. In situ microanalysis of the U-Pb system can give us the age of a single zircon grain, while the isotopic composition of its Hf tells us whether its parent magma was generated in the mantle, or by remelting of older crust.
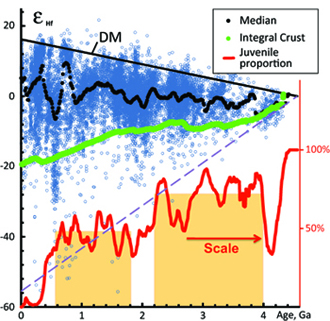
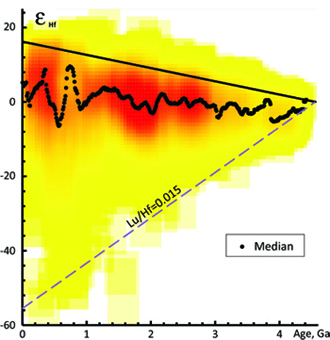
Figure 1. εHf
a versus zircon U-Pb age for all zircons in the database (N=13,844): (A) the green line is the calculated integral εHf of the crust and the red line is the calculated juvenile proportion (right-hand scale); (B) data are illustrated by a two-dimensional histogram with each element/cell representing 50Ma × 1 εHf unit and the window of smoothing is 250 Ma × 5 εHf, where the full dataset is taken as 100%. More intense colours (into red) indicate higher density of the data. Dashed line shows the evolution of "average crust" from 4.56 Ga.
GEMOC's TerraneChron® program (integrated U-Pb, Hf-isotope and trace-element analysis of zircon) has built up a worldwide database of about 14,000 analyses of zircon, derived largely from detrital sources. This has been used to examine processes of crustal evolution on a global scale, and to test existing models for the growth of continental crust through time (Fig. 1; GEMOC Publication #671). In this study we introduced a new approach to quantitatively estimating the proportion of juvenile material added to the crust at any given time during its evolution. However, no zircon database, even our very large one, can be completely representative of the upper crust, because the samples have not been taken randomly. To overcome this sampling bias, we have normalised our data to the relative areas of Archean, Proterozoic and Phanerozoic crust that have been mapped in GEMOC's GLAM project (see GEMOC Publication #547).
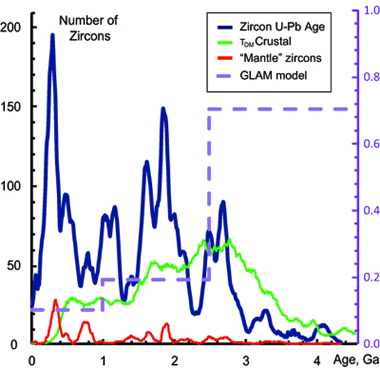
Figure 2. Relative probability curves (left scale) of U–Pb zircon ages (blue line), TDM C model ages (green line) and number of zircons with juvenile Hf-isotope compositions (red line; defined as grains with εHf=0.75×εHf DM). Proportions of the continental lithosphere formed during three major time intervals derived from GLAM mapping are shown by the dashed line (right axis).
This estimate has then been used to model the crustal growth rate over the 4.56 Ga of Earth's history. The model suggests that there was little episodicity in the production of new crust, even though plots of the magmatic ages of rocks show marked peaks at some time intervals (Fig. 2).
The distribution of age-Hf isotope data from zircons worldwide implies that at least 60% of the existing continental crust separated from the mantle before 2.5 Ga (Fig. 3). However, taking into consideration new evidence coming from geophysical data, the formation of most continental crust early in Earth's history (at least 70% before 2.5 Ga) is even more probable. Thus, crustal reworking has dominated over net juvenile additions to the continental crust, at least since the end of the Archean. 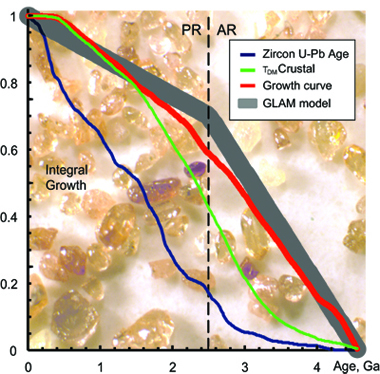 This explains the increasing number of zircons with non-radiogenic Hf-isotope compositions (with εHf lower than -20) found throughout post-Archean time. Moreover, the proportion of juvenile material in newly formed crust decreases stepwise through time: it is about 70% in the 4.0 – 2.2 Ga time interval, about 50% from 1.8 – 0.6 Ga, and possibly less than 50% since 0.6 Ga (Fig. 1A). These changes maybe related to the formation and breakup of supercontinents. This study thus represents a major advance in our understanding of the genesis of the continental crust through time.
Contacts: Elena Belousova, Bill Griffin
Funded by: ARC Linkage Project Grant and industry projects
Figure 3. The integrated crustal growth curve (red line) derived in this study, compared with the GLAM (Global Lithospheric Architecture Mapping) model shown as a grey band. Integrated curves for the zircon U-Pb age data and crustal model age are shown for comparison.
The Earth's first continental crust
The earth's oldest continental crust is composed primarily of felsic rocks of the tonalite-trondhjemite-granodiorite series (commonly known as TTGs). These granitoids typically occur as plutons that are encompassed by belts of metamorphosed mafic volcanics (known as greenstones). In spite of their close association, the exact relationship between the TTG granitoids and surrounding greenstones is problematic. This is partially because original stratigraphic contacts are rarely preserved in such old rocks. Another problem is that, although it is generally believed that TTG magmas were produced by the partial melting of an older basaltic crust, the tectonic environment in which this occurred is unknown and appears not to have any modern analogues. We have approached these difficulties by obtaining specifically relevant experimental and geochemical data for greenstones from one of the oldest known greenstone belts (the Nuvvuagittuq belt of northern Quebec, dated at 4.28 billion years). Our objective is to test for a direct genetic link between the greenstones and a closely associated but younger (3.66 billion years) tonalite (PC-103) of the TTG series.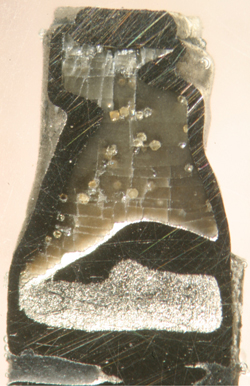
A significant characteristic of the Nuvvuagittuq greenstones is their resemblance to much younger volcanic rocks called boninites, which are now exclusively associated with subduction zones (and hence with plate tectonics). Two samples of Nuvvuagittuq greenstone were used as starting materials for the experiments. These included PC-227 and PC-162 which are among the most mafic and least altered of the Nuvvuagittuq greenstones. For comparison, experiments were also conducted on a modern boninite from northern Tonga. The experiments were undertaken at GEMOC using powdered samples of natural rock. They were conducted in end-loaded piston-cylinder apparatus using conventional techniques. Analyses of the run products and starting materials were done by electron microprobe and ICP-MS at the GEMOC Geochemical Analysis Unit.
Figure 1. A longitudinal section through an experimental capsule showing the outer metal capsule (made of silver-palladium alloy) and rounded crystals of yellow garnet in a tonalitic glass.
At temperatures of 950 ºC to 1050 ºC and pressures of 1.5 GPa to 2.0 GPa, the greenstones and boninite undergo between 30 % and 45 % partial melting and produce residual garnet ± clinopyroxene ± orthopyroxene (Fig. 1). The partial melts have tonalitic compositions and are similar in many respects to the natural tonalite PC-103. They have similar concentrations of most major elements and also produce similarly shaped patterns on mantle-normalised plots of incompatible element concentrations (Figs. 2 and 3). The latter may reflect a familial connection between the original greenstones and associated tonalite. This is because the comparatively high degrees of partial-melting needed to form the tonalitic melts have relatively little effect on the relative concentrations of most incompatible elements. It is only the influence of residual garnet that is needed to produce the distinctively inclined heavy Rare Earth patterns that characterise both the experimental and natural tonalite compositions.
Although the overall concentrations of incompatible elements in the experimentally-produced melts are lower than those of the natural tonalite, this is due to our use of the most mafic and incompatible-element-poor greenstones as starting materials. 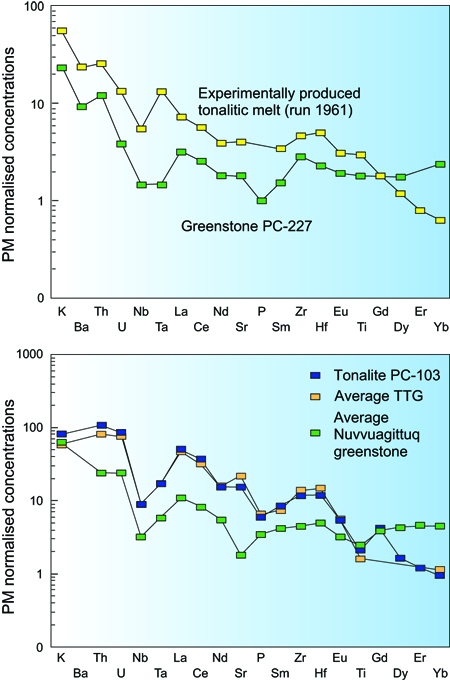 On average, the Nuvvuagittuq greenstones are considerably more enriched in incompatible species than our starting materials, although the relative concentrations of most elements are similar. If this factor is taken into account (compare Figs. 2 and 3), it seems likely that the TTG PC-103 inherited many of its primary geochemical characteristics from an earlier fractionation event that also produced the basaltic Nuvvuagittuq lavas (now represented by the greenstones).
Figure 2. Mantle-normalised concentrations of incompatible elements in the greenstone PC-227 and an experimentally produced tonalitic melt that resulted from partial melting of PC-227.
Figure 3. Mantle-normalised incompatible element concentrations in the tonalite PC-103, an estimated average TTG, and in an average Nuvvuagittuq greenstone.
Although modern magmas compositionally similar to the Nuvvuagittuq greenstones are associated only with subduction zones, our experiments do not provide additional support for the existence of plate tectonics on Earth during the Hadean. Instead, they are consistent with continental crust formation that involved some kind of crustal re-cycling process during the Hadean. Regardless of whether this process was plate tectonics (or something else) it must have replicated many of the magmatic consequences of modern plate tectonics, including arc-like basaltic magmas. It must also have occurred on a sufficiently large scale that it was able to exert a major compositional influence on the first continental crust.
Contacts: John Adam, Tracy Rushmer
Funded by: ARC Discovery Project Grant
On the edge: Continent roots and giant Nickel deposits
The location of magmatic ni-cu-pge sulfide deposits is closely related to lithospheric architecture, particularly the deep roots of sub-continental lithospheric mantle (SCLM). Giant deposits are found close to the margins of cratons, the large (100s to 1000s of km across) stable blocks produced by the amalgamation of smaller chunks of thick lithosphere (mantle root plus overlying crust) during Precambrian tectonic collisions (Fig. 1). These deposits are associated with mafic-ultramafic rocks, especially the massive outpourings of magma known as Large Igneous Provinces. The metal quantities and grades observed in such deposits require segregation of a magmatic sulfide melt from a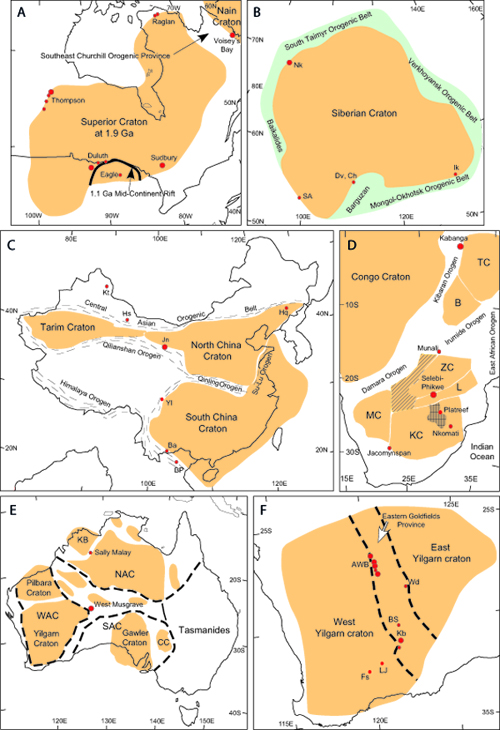 very large volume of parental ultramafic melt. This requires a high degree of melting at depths of 100 km or less; this and the large melt volumes involved are consistent with a mantle-plume origin. Some small- to medium-sized deposits may be associated with melting of upwelling asthenosphere following delamination of the lithospheric mantle. Segregation of the sulfide liquid from the melt may be triggered by interaction with crustal rocks. This liquid eventually forms disseminated or massive sulfide accumulations in the host mafic or ultramafic rocks.
Figure 1. Examples of cratonic/lithospheric architecture (orange polygons and dashed polygons) and the location of nickel sulfide deposits (red dots; size reflects relative deposit size for each region). See GEMOC Publication #664. A) Proterozoic deposits of North America at ca 1.9 Ga. B) Siberian craton. Lighter grey is area of Middle to Late Proterozoic and/or Phanerozoic orogenic reworking and possible terrane accretion. C) Cratons of China; flanking Phanerozoic orogens are patterned. D) Cratonic architecture of southern Africa. E) Proterozoic deposits of Australia. F) Neoarchean deposits of the Yilgarn craton, Australia.
All deposits formed during periods of active regional tectonism, most commonly under mildly compressional to transpressional conditions. The timing and tectonic setting of the deposits are consistent with a plume impact (craton margin) model involving 5 stages (Fig. 2):
1. Mantle plume impact and upward flow towards areas of thinner lithosphere
2. Plume decompression melting at shallower levels
3. Melt transfer into the (upper) crustal environment via active trans-lithospheric faults and an interconnected intrusion (sills) network
4. Variable interaction of melts with crust
5. Nickel sulfide precipitation and accumulation
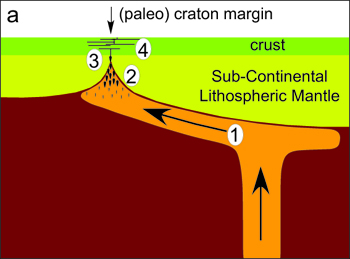
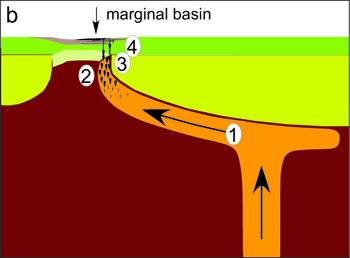
Figure 2. Generalised model showing formation of nickel sulfide deposits at tectonically active margins of thick (>150 km) lithospheric blocks (mostly cratons; after GEMOC Publication #664). In scenario a) the blocks are contiguous, whilst b) depicts a small, intervening marginal basin. The former encourages evolution of the melt via ponding and wallrock interaction at all crustal levels, with resultant deposits found mostly within mafic host rocks. The latter (b) favors shallower melting of the plume, direct melt access to the upper crust, and therefore typically ultramafic host rocks.
Most large deposits formed in intracontinental settings, or with (former) passive margins at the edge of small marginal basins. The rarity of large deposits associated with the margins of large oceans or with subduction-zone environments reflects either poor preservation or (with the latter) limitations on plume interaction with continental lithosphere. The model provides a coherent predictive framework for mineral exploration.
Contacts: Graham Begg, Jon Hronsky, Bill Griffin and Sue O'Reilly
Funded by: BHP Billiton (and previously by WMC Resources), and Discovery, SPIRT, and Linkage grants from the Australian Research Council
Noble method updates the Ni exploration toolkit
Komatiites contain some of the world's largest nickel-sulfide deposits and the development of reliable lithogeochemical indicators to guide exploration has been a long-standing goal. A common lithogeochemical approach is to identify whole-rock signatures that record sulfide segregation, and use these to predict if a system has reached sulfide saturation and therefore is worth exploring for nickel sulfide deposits. For this purpose the platinum-group elements (PGE: Os, Ir, Ru, Rh, Pt, Pd) are of great interest. The PGE are chalcophile and partition very strongly into segregating sulfides, which produces a PGE depletion in the remaining silicate melt. However, PGE abundances in ultramafic melts and/or rocks reflect a complex range of factors including magmatic processes and emplacement dynamics, alteration, metamorphism, and weathering. As a consequence, whole-rock signatures depleted in PGE may not reflect the segregation of sulfides. Moreover, the changes in whole-rock PGE geochemistry are mostly too subtle and too ambiguous to be used in exploration, because their low concentrations (a few parts per billion) are a challenge to the analyst.
Rather than working with whole-rock signatures, GEMOC is using its state-of-the-art micro-analytical facilities to probe minerals that record the geochemical evolution of ultramafic systems. In situ mineral analysis by laser ablation ICP-MS enables measurement of PGE concentrations down to the low ppb level in spots a few microns across. The research focuses on the role of chromite in the fractionation and concentration of ruthenium (Ru) b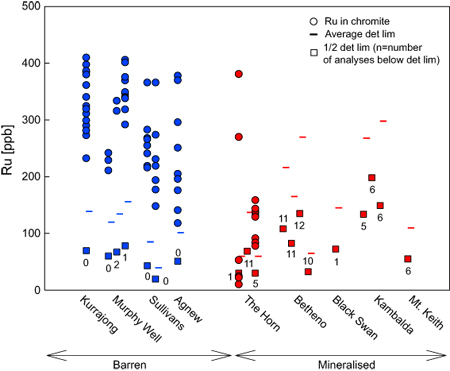 ecause chromite can host Ru in solid solution (see Research Highlights 2009). The Ru content of chromite should therefore reflect if the chromite crystallised in a sulfide-undersaturated (barren) or sulfide-saturated (potentially mineralised) system.
Figure 1. Ruthenium variation in chromite as observed in barren (blue symbols) and mineralised (red symbols) komatiites from Western Australia.
To test this idea, we have analysed chromite in a wide range of komatiites from the Eastern Goldfield's Superterrane (EGST) in the Yilgarn Craton of Western Australia. The EGST contains some of the world's largest komatiite-hosted nickel deposits. Numerous previous studies and an intense mineral exploration history make this an excellent natural laboratory for the investigation of komatiite geochemistry. Laser ablation ICP-MS data show that chromites from barren komatiites (Agnew, Kurrajong, Murphy Well and Sullivans) have Ru concentrations between 120 and 420 ppb (Fig. 1). In contrast, the Ru contents of chromites from the world-class nickel deposits at Mount Keith (Fig. 2), Kambalda, Black Swan, and Betheno are below the 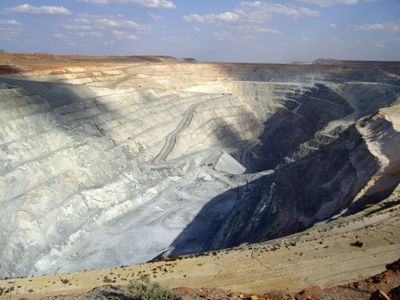 detection limit of the laser ablation ICP-MS (down to 5 ppb, depending on grain size and measurement conditions). The one exception found so far is a nickel deposit at The Horn, where the chromites have Ru concentrations mostly between 10 and 150 ppb; this is still distinctly lower than the mean concentrations observed in chromites from the barren komatiites.
The results suggest that the partitioning of ruthenium into chromite is dominantly controlled by the sulfide content of the system. In sulfide-saturated systems, the chalcophile Ru will dominantly partition into sulfides, whereas in the absence of sulfides, Ru partitions into chromite. Therefore, Ru concentrations in chromite can be used in the exploration for nickel-sulfide deposits, based on the empirical evidence that Ru-enriched chromites are associated with barren systems. 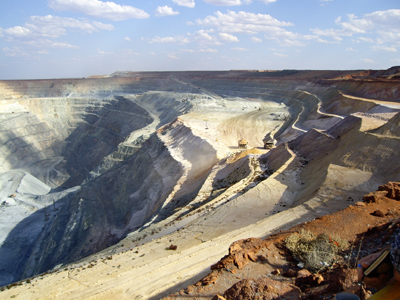 This method can be applied directly to polished sections and/or grain mounts and therefore provides a rapid and
cost-effective tool in the hunt for nickel-sulfide deposits.
Contacts: Marek Locmelis, Norman Pearson
Funded by: ARC Discovery Project Grant (O'Reilly, Griffin and Pearson), MQRES, EPS Postgraduate Fund
Figure 2. The Mount Keith Open Pit Mine in Western Australia – one of the world's largest komatiite-hosted nickel deposits.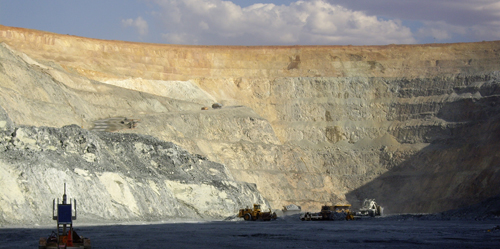
Zircons from the roof of the world unearth Himalayan evolution
The tibetan plateau, one of the most remarkable places to visit in Asia for travellers, is known as the roof of the world. The formation of such a high broad uplift naturally attracts geologists' curiosity. Following decades of investigations, we know that it formed during the collision between the Indian and Eurasian plates. However, some details remain controversial, for instance: when did these two plates collide, (from Late Cretaceous to Oligocene), and what mechanisms support the immense relief? Now, in situ analysis of Hafnium isotopes in zircon, commonly a trace mineral, combined with the isotopic analysis of Hafnium and Neodymium in its host rocks in the southern part of the Lhasa terrane, offer us new answers to these questions.
In this study, we analysed rocks from the south Transhimalayan batholiths, including Gangdese granitoids and Oligo-Miocene adakites. Our integrated Hf and U-Pb isotope analyses of zircon crystals, together with Hf and Nd isotopes of their host rocks, show a secular change in the magma sources that can be related specifically 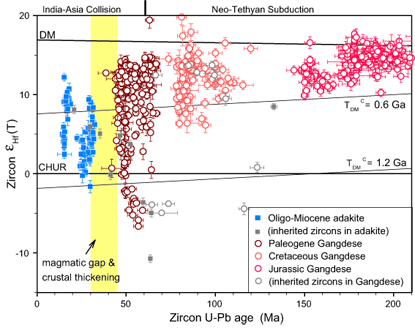 to the encroachment of the Indian plate into the southern part of the Tibetan orogen during the continental collision.
The magmatic zircons, crystallised between ca 200 Ma and 50 Ma, mainly show depleted mantle-type Hf-isotope characteristics but this changes markedly in the Paleogene (Fig. 1). The Hf-isotope shift is interpreted as reflecting the subduction of the Himalayan sediments, driven by the approach of the Indian plate, and thus signals the initiation of the India-Asia collision by 55 Ma.
Figure 1. In situ Hf and U-Pb isotopic data for zircons from Gangdese granitoids and Oligo-Miocene adakites in the southern part of the Lhasa terrane.
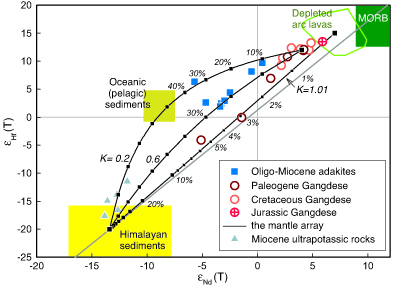 Our data also indicate that the crust of southern Tibet thickened significantly between ca 45 - 30 Ma, before emplacement of the post-collisional adakites (Mg-rich silicic igneous rocks). These adakites exhibit Hf-Nd isotopic systematics different from the previous Gangdese magmatism, suggesting mixing of melts from (a) the juvenile Gangdese mafic crust and (b) incorporated Himalayan sediments, with zircon residues fractionating Nd and Hf abundances during crystallisation (Fig. 2).
See GEMOC Publication #730.
Figure 2. Whole-rock εHf(T) vs εNd(T) plots of the Transhimalayan rocks, showing how the adakites fall along mixing curves between the older Gangdese magmas and Himalayan sediments.
Contacts: Mei-Fei Chu, Norman Pearson, Sue O'Reilly
Funded by: ARC Discovery Project Grant
The Big Bang - New insights into the 1912 eruption of Katmai volcanoe
In june 1912, the biggest and one of the most compositionally diverse eruptions of the last century took place in the Katmai group of volcanoes on the Alaska Peninsula. In the space of 60 hours,
13 km3 of rhyolite, dacite and andesite magma were explosively ejected, producing an ash cloud 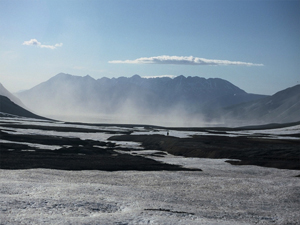 covering 77,000 km2 that extended as far east as Greece and filled the Valley of Ten Thousand Smokes. The eruption started with a crystal-poor rhyolite followed by a gradual increase in the proportions of dacitic and andesitic material. The eruption took place from a vent at the site of the present-day Novarupta dome, but the magma came from beneath the summit of Mount Katmai 10 km to the east. As the magma moved out, the summit started to collapse some 11 hours after the onset of the eruption, finally forming a 5.5 km3 caldera. New geochemical data are now giving a very detailed picture of the lead-up to this massive volcanic eruption.
View along the Valley of Ten Thousand Smokes towards Mount Katmai.
The entire major- and trace-element range in the successive magmas can be modeled by 80-90% closed-system crystal fractionation over a temperature interval from 1279 to 719 °C at 100 MPa, starting with about 65 km3 of parental basaltic magma. Numerical thermal 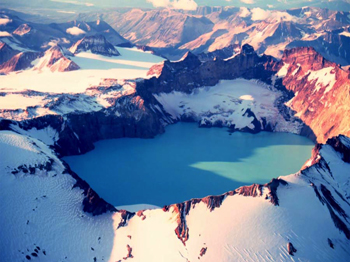 models suggest that, for wall rock temperatures appropriate to this depth, this volume of magma would cool and crystallise by 90% over this temperature interval within a few tens of thousands of years. However, a significant range in 87Sr/86Sr, (230Th/238U) and (226Ra/230Th) in the magmas requires open-system processes. The U-series isotopes indicate that crustal residence times for some dacites were close to 8000 years, whereas the rhyolites appear to be significantly older (50-200 kyr). Thus, magmas that erupted within only 60 hours of one another in 1912 had resided in their crustal magma chambers for quite different time spans. Nevertheless, because they were emplaced in the same thermal regime, they all evolved along similar liquid lines of descent from parental magmas with similar overall compositions. The system was built up progressively with multiple injections of mafic magmas, which provided both mass and heat; some of the heat led to melting of older
Aerial view of Mount Katmai showing the caldera that formed during the 1912 eruption (Captain Budd Christman, NOAA Corps).
silicic material that provided much of the magma mass for the rhyolite. Although this scenario is increasingly recognised as a common one, it cannot be deduced from field observations or major- and trace-element compositional variations. Only the data from short-lived radioactive isotopes are sensitive to processes such as protracted magma build-up, differentiation, assimilation and eruption.
Contact: Simon Turner
Funded by: National Environment Research Council, UK
Journey from the centre of the Earth: xenoliths reveal the velocity of magmas
The rates at which magmas rise through the crust and upper mantle cannot be measured directly, but can be estimated by several indirect means, based on observations from mantle-derived xenoliths in alkali basalts, kimberlites and related rocks (GEMOC Publication #666). These magmas are generated in the convecti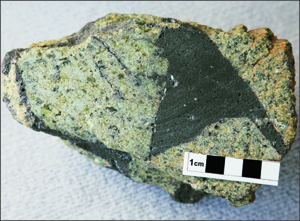 ng mantle at depths from about 90 to 200 km, commonly are not fractionated during their ascent and may incorporate fragments of the lithospheric mantle as they travel through it.
Figure 1. Angular xenoliths of spinel peridotite in alkali basalt from Batchelor Crater, Queensland, Australia.
At upper mantle temperatures and pressures (depths of 50-250 km and temperatures of 1000-1300 °C), mantle rocks have been shown to deform plastically, at least in response to long-term stresses. However, the entrainment of xenoliths in an ascending magma requires that fragments of rock be broken off the walls of magma chambers or conduits, a process that implies brittle fracture in response to short-term stresses. This brittle response is evidenced by the typically angular to subangular shapes (Figs. 1,2), resulting in polygonal and facetted xenoliths (Fig. 3), and the common linear contact surfaces of veins in xenoliths (Fig. 4). Significant rounding is restricted to xenoliths from breccias or those associated with the more explosive eruptions such as maars, diatremes, and some cinder cones. Xenoliths in kimberlites are typically more rounded than those in basalts, but many display planar faces (Fig. 3). This rounding appears to reflect tumbling of xenoliths during turbulent ascent and eruption. However, we infer that at the time of their entrainment, most xenoliths are angular, and originated by brittle fracture.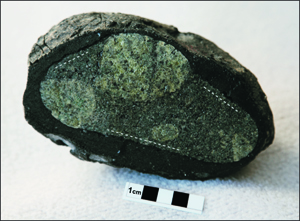
Figure 2. A composite xenolith showing spinel peridotite veined by basaltic magma that crystallised in the mantle, within a volcanic bomb from Mt Shadwell, Victoria, Australia. Note the originally straight sides (emphasised by white dashed lines) and the rounded edges of the xenolith due to abrasion in the magma. The spinel peridotite areas appear rounded due to reaction with the invading basaltic magma.
The mineral assemblages and mineral chemistry of many xenoliths can be compared with experimental studies to derive the depth and temperature at which they were picked up by the ascending magma. These xenoliths therefore can provide constraints on the shallowest depths of magma generation and segregation, and on how rapidly magmas get to the surface.
The rates of ascent of magmas are equivalent to the residence times of xenoliths in the magma after their entrainment. These rates can be estimated by a variety of methods using the physical and compositional parameters of the xenoliths. Mantle-derived peridotite, eclogite and pyroxenite xenoliths are relatively dense, and the magma must be ascending more rapidly than the xenoliths can sink through it. These calculations suggest an average ascent rate through the whole lithosphere (mantle and crust) in the range of 0.2 to 0.5 metres per second (about 0.5 to 2 km/hour). The ascent rates through the shallow crust may be much higher; >20 metres per second and up to supersonic speeds ( ≥300 metres per second) in the uppermost crust. 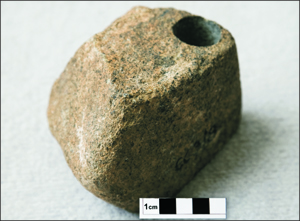
Residence times of xenoliths in the magma also can be estimated using calculations based on temperature-related diffusion phenomena (chemical zoning, grain-boundary adjustment) observed in xenoliths; all of these approaches suggest ascent rates in the range of 0.2 to 0.4 metres per second.
Figure 3. Xenolith from kimberlite showing polygonal shape with planar surfaces.
It has been suggested that high contents of CO2 in magmas provide a significant "propellant effect" to assist xenolith transport. This is not correct, because the density and viscosity of the mixed magma-fluid system are lower than those of unmixed magmas. However, the exsolution of CO2 both provides heat that helps to prevent the magma from cooling during ascent, and enhances crack propagation. Magmas representing significant proportions of partial melting, such as tholeiitic basalts, rarely carry mantle-derived xenoliths; this probably reflects ascent rates that are too slow to hold (or possibly incorporate) high-density xenoliths entrained in the magma.
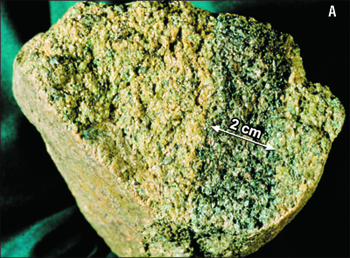
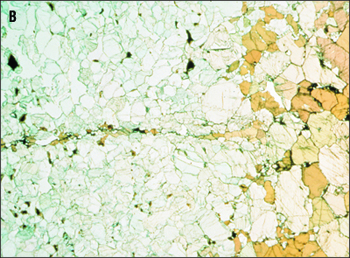
Figure 4. A: Spinel peridotite xenolith showing straight-sided vein of garnet pyroxenite (basaltic magma crystallised within the mantle). B: Photomicrograph of thin section of a peridotite showing an amphibole-rich vein with thin offshoot. Note the straight sides on both the large and small veins. Field of view is 2.5 cm across.
In summary, magmas carrying mantle xenoliths must reach the surface within a maximum of about 8 to 60 hours after picking up these dense fragments from depths of about 200 to 80 km depth. See GEMOC Publication #666.
Contacts: Sue O'Reilly, Bill Griffin
Funded by: ARC Discovery Project Grants
Core formation in partially molten planetesimals: A complex network analysis
The segregation of metallic cores from silicate mantles is one of the earliest, and most important, differentiation processes in the evolution of terrestrial planetary bodies. Although a magma-ocean model is commonly used for efficient core formation, more recent scenarios using calculations from extinct radionuclides (e.g. 26Al, 60Fe) call for segregation of the core from partially molten silicate – a silicate "mush matrix". This segregation scenario requires growth of molten core material into blebs large enough to overcome the strength of the mush matrix so that separation can occur. The geochemical ramifications can be significant because bleb size will control the degree of equilibration. In collaboration with colleagues from the Mathematics Department at the University of Melbourne (A. Tordesillas and D. Walker), we have developed an innovative approach that combines partial-melting experiments on natural materials with complex-network analysis to quantify the growth of metallic melt regions in a silicate mush matrix. The presence of silicate melt is a significant transition point in the segregation of liquid metal and we are characterising this by using graph-theoretic techniques from Complex Networks. Properties of the networks have been constructed from the experimental data to determine whether the molten metal and silicate zones are tending to mix or separate, as manifested 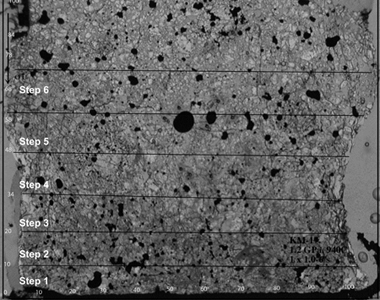 in the liquid metal blebs growing during melting and deformation of the rock sample (Fig. 1).
Figure 1. A backscattered-electron image of experiment KM-17, deformed at 940oC, 1.2 GPa and at 1.0 x 10⁻⁶/s. Metal-sulfide eutectic quench liquid is most common and forms blebs in the silicate glass in the middle of the sample. The grid is placed on top of the sample and data collected at every point (100 data points per line by approximately 10 lines per step). Steps were chosen by the changes in the modes of melt and liquid vs unmelted material and go from step 1, where no melt or liquid metal is present, to step 6 where silicate melt fraction is the highest.
Complex Network Analyses: A basic network or graph consists of nodes, with some pairs of nodes connected by a link. Here, the networks are constructed from textural information collected at distinct sampling sites located at the intersection points of a near-regular sampling grid placed on the experimental sample. The sampling sites are then assigned to the nodes of a complex network. The topological structure of such a network is uninteresting. However, if we then label each node as a "type" according to the sampled data, i.e., node type indicates silicate melt, liquid metal, etc. then there are useful network measures to summarise the patterns of connections between node types (Fig. 2). One such measure is the assortativity, which quantifies a node's 'preference' to attach to other nodes of the same type. In complex networks, the statistics that are most associated with assortativity arise from the question of whether network nodes of the same degree (number of links attached to a node) are typically connected to each other. A random network where there is no discernable pattern of mixing has an assortativity measure of zero. We performed this analysis on the experimental data to establish whether separation of liquid metal from silicate melt (positive assortativity) or mixed (negative or zero assortativity) has occurred in the silicate mush matrix under deformation.
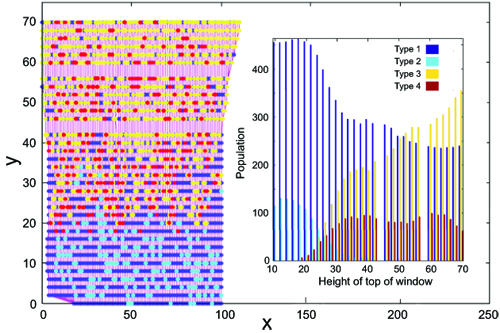
Figure 2. Full sample grid showing spatial distributions of type 1 (solid silicate), type 2 (solid metal), type 3 (liquid silicate) and type 4 (liquid metal). 29 windows "slide up" the sample, starting from the bottom of the sample (step 1) and ending at the hot spot with the highest melt fraction of both metal and silicate (step 6). The change in the population of each type as the window moves up is shown in the inset: in step 1, type 1 is dominant with some type 2, but by step 6, type 3 is dominant with some types 1 and 4.
Results: For the assortativity coefficient, we found that the sample subnetworks evolve to a highly disassortative network due to the early dominance and residual presence of type 1 (solid silicate) within the sample. This is expected as it is a mush, so that solid silicate remains even in the highest temperature zone. For the subnetwork of liquid metal and silicate melt, we observed an assortativity coefficient around zero for heights above y=20 (types 3, silicate melt, and 4, liquid metal, are absent from the sample below this height) which is indistinguishable from a random mixing pattern. A simple randomisation test of the assortativities of surrogate random networks, each constructed by assigning node types 3 and 4 randomly, confirmed this. At heights beyond y=60, we find that the experimental sample with respect to node types 3 and 4 had evolved to a pattern with a significant positive assortativity coefficient (Fig. 3). In this area of the sample, there is significant "clumping" of the silicate melt and the liquid metal in the sample with respect to height (i.e. with increasing temperature and deformation). At y=60 and above, the zone of the highest strain and concentrated deformation, we find the highest fraction of silicate melt. 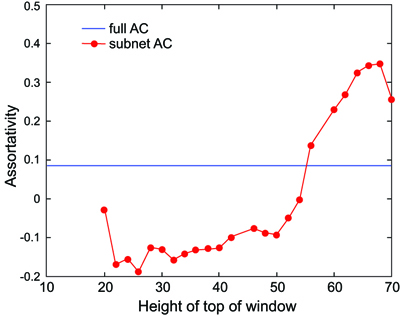
Figure 3. Assortativity coefficient of the 29 sliding window subnetworks consisting of nodes of types 3 and 4 only (from Fig. 2, nodes of types 3 and 4 do not exist below y=20). The blue line shows the equivalent value of the assortativity coefficient for the global network comprising all types for the entire sample (window size is the full sample).
This novel approach has allowed us to quantify the texture by treating the four-phase system as a complex network. We see a "clumping" of metallic liquid and of silicate liquid as the proportion of silicate melt increases (from steps 1 to 6 in the sample) and deformation is concentrated in this weaker partially molten zone (step 6). The clumping processes may be driven by a combination of low pressure (dilational sites) in the mush zone, developed during deformation, and contrasts in surface energy and viscosity between the silicate melt and metallic liquid. The analysis of the textural data in step 6 shows that the network is assortative; the nodes of the same type are more likely to be connected together. This analysis can allow us to extract unambiguous network trends that can then predict the growth of blebs in the presence of silicate melt. This can then be used in calculations that include a modified Stokes Law to predict sinking rates for core formation in partially molten planetesimals.
Contact: Tracy Rushmer
Funded by: ARC Discovery Project Grant
Catastrophic overturn on Enceladus
New research at gemoc has explained the enigmatic behaviour of enceladus, Saturn's sixth-largest moon. This tiny ball of ice and rock is only 500 km across—and yet it hosts a level of geologic activity comparable to Earth.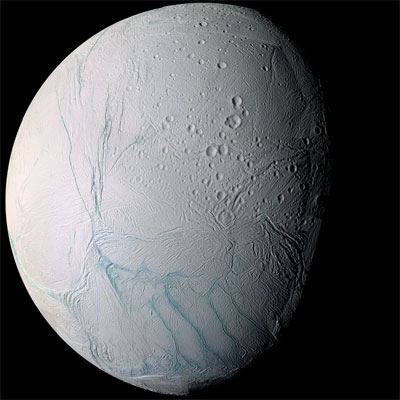
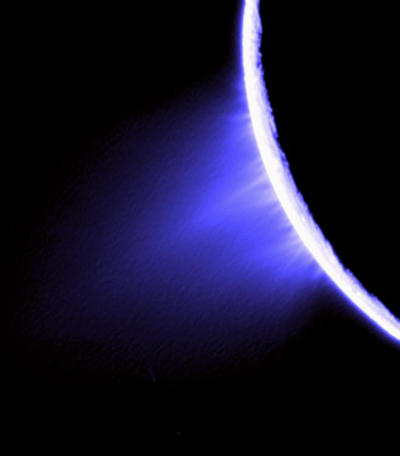
Enceladus's south pole erupts water-rich geysers into Saturn's ring system, from a region carved up by unusually warm fractures known as 'tiger stripes'. Thermal imaging of the moon's surface by the Cassini space-probe indicates that Enceladus is losing far more heat than it should be generating - a fundamental disparity in the thermal balance of the body. What's more, the south pole terrane is geologically young - cratering statistics indicate that it is less than 100 Myrs old, and perhaps much younger. In contrast, heavily cratered plains on Enceladus yield ages of up to 4.2 Ga - as old as any surface in the outer solar system, while the moderately cratered plains of Sarandib Planitia and Samarkand Sulcus yield ages of 170–3,750 Myrs and 10–980 Myrs, respectively. The episodic distribution of ages of different terranes on Enceladus implies that Enceladus has experienced localised periods of surface activity, interspersed with periods of relative inactivity.
Figure 1. Cassini photograph of Enceladus, showing the relatively young South Pole Terrane, exhibiting a sub-linear 'Tiger-stripe' fracture system, and much older heavily cratered plains to the north. (Credits: NASA)
In a paper published in Nature Geoscience in 2010 (GEMOC Publication #621), we proposed a model to resolve the discrepancy between Enceladus's heat production and heat loss. In this model, the massive heat loss at the moon's south pole can be explained by a periodic tectonic regime, resulting in geologic eruptions - such as those now visible on Enceladus - occurring every billion years or so.
 As Enceladus orbits Saturn, the massive planet's gravitational pull causes the icy moon to flex, generating tidal heat on the satellite. Enceladus's orbit is not circular, so as it goes around Saturn its orbital distance changes, and the gravitational force that it feels changes slightly. As a result Enceladus is constantly squeezed and stretched, generating a lot of heat, like a squash-ball being squeezed in a hand. Radioactive decay - which powers most of Earth's tectonism, is only marginally important on Enceladus.
Despite its high range of tidal heating, Enceladus is still losing many times more heat than tidal sources can account for. Either something is unaccounted for, or the heat being released today is not matching the steady-state production rate. Instead, Enceladus may be in the middle of a 'pulse' of transiently enhanced heat loss well above its background average.
Figure 2. Water-rich geysers emanating from the 'Tiger-stripe' fractures in the South Pole Terrane. Image from UV Camera. (Credits: NASA)
The new research suggests what we are seeing on Enceladus now is a transient period of active lid behaviour—a brief episode of tectonic activity that resurfaces a limited area of the moon. In the new model, heat is pent up inside the interior over billions of years, building up to a critical level and then escaping in one big pulse of activity. The models show that episodic partial-lid recycling occurs for plausible lid strengths and Enceladus's estimated supply of tidal energy. The localised nature of such overturn episodes, their periodicity of 0.1–1 billion years and an anomalous heat flow during these episodes are consistent with Enceladus's geology and modelled heat supply.
The models suggest that the pulses of activity would last for around 10 million years - a blink of an eye, geologically. Outside these active episodes, Enceladus would exhibit a more dormant, stagnant-lid mode of convection - not unlike many other icy moons. But if this periodic tectonic behaviour is endemic to icy satellites with evidence of partial resurfacing throughout the solar system, the other satellites also should show signs of episodic resurfacing. Indeed, Ganymede, Rhea and Miranda all show signs of episodic resurfacing deep in their geological past, and so transient tectonics in the outer solar system may be more common than previously thought.
Contact: Craig O'Neill
Funded by: Macquarie CoRE funding
Brilliant imaging: new facets of diamonds' deep inner secrets
Diamonds, along with the mineral and fluid inclusions they can contain, represent the deepest direct samples from the Earth's mantle. Studying these diamond "capsules" as well as their contents has shed light on the chemistry of mantle fluids. A principal technique in the world of diamond research is infrared (IR) spectroscopy. This is a very simple technique for observing and quantifying the impurities that commonly occur in the diamond lattice, including both nitrogen and hydrogen. It is now the main technique used for diamond classification, which is based upon the abundance and nature of the nitrogen impurities.
Developments in IR analytical capabilities have made the mapping of these impurities far easier and quicker than ever before. The most modern equipment, as used in GEMOC, can collect thousands of point spectra across a single diamond in a single working day. However, for quantitative anaysis, the raw FTIR spectra must be deconvoluted. This has produced a requirement for an automated method that can accurately deconvolute thousands of spectra and quantify the most common impurities. We have developed an open-source (i.e. free to access) software routine (DiaMap) that automatically deconvolutes the spectra and quantifies the main nitrogen and hydrogen impurity features of a diamond. This includes the nitrogen concentration and aggregation state, the size of the platelet peak (interstitial carbon aggregates formed as a by-product of nitrogen aggregation) and the relative abundance represented by the main hydrogen peak.
Maps of diamond MC06 (top) and MC12 (bottom), made up of thousands of infrared spectra, showing the relative intensity of the dominant hydrogen band (3107 cm^-1) in diamond. The hydrogen concentration correlates with cuboid growth, which is a different growth mechanism to that which produces perfect, octahedral gem quality diamonds.
Application of this technique has already shown some interesting results with respect to diamonds of mixed-habit growth. These are diamonds that show periods of smooth faceted octahedral growth and rough, hummocky cuboid growth, occurring at the same time. This often results in a center cross feature, which may or may not be obvious to the naked eye. A common feature observed in these types of diamonds is that platelet concentrations are much lower in cuboid sectors relative to contemporary octahedral sectors. No satisfactory reason for this has ever been given, but the most recent idea suggests that the high concentrations of hydrogen in cuboid sectors inhibit nitrogen aggregation, resulting in reduced platelet production. However, our new IR mapping shows that aggregation state of N can be the same in contemporary sectors, while platelet concentrations are lower in the cuboid sectors. This leads to the more logical conclusion that other defects (disc-like cracks), which are only found in cuboid sectors, are responsible for reducing the quantity of interstitial carbon atoms and therefore lowering the platelet concentrations. This has serious implications for another commonly utilised diamond classification method, based on platelet concentrations.
The application of this IR mapping method, in combination with other techniques like laser ablation mass spectrometry (LA-ICP-MS) to measure trace elements, cathodoluminescence imaging to reveal growth stratigraphy, and secondary ion mass spectrometry (SIMS) to measure carbon isotopic ratios, will reveal further information about the role of fluids in the mantle.
Contacts: Dan Howell, Craig O'Neill, Bill Griffin
Funded by: ARC Discovery Project Grant
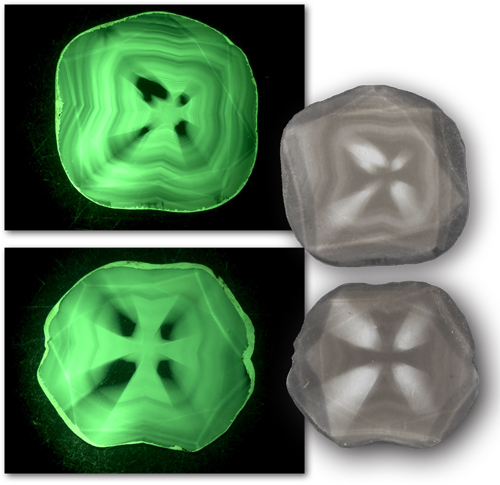
Images of sample MC06 (top) and MC12 (bottom) taken under UV light. The luminescence comes only from the cuboid sectors (shown to be hydrogen-rich by the IR maps) while the octahedral sectors appear black. The cross feature that appears by luminescence is the reason these mixed-habits diamonds are commonly referred to as "star" or "centre-cross" diamonds.