 Research Highlights 2008
TerraneChron®
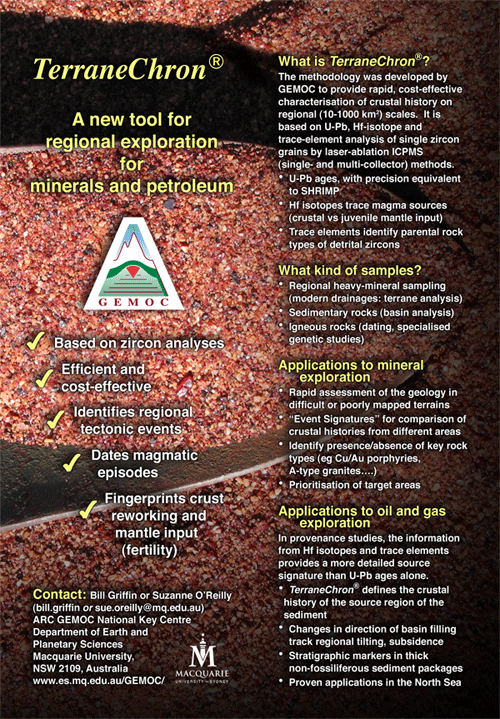
TerraneChron® is GEMOC’s unique methodology for terrane evaluation. During 2008 a range of new studies including collaborative research projects with industry using TerraneChron® expanded our knowledge of crustal evolution and the timing of tectonic events. TerraneChron®'s success was recognised at the Australian Research Council Graeme Clarke Outcomes Award Day held at Parliament House, Canberra in May 2008.
How the world was made: The GLAM project
The cover of this year’s annual report features one of the recent outputs of GEMOC’s Global Lithospheric Architecture Mapping (GLAM) project. This major effort began 5 years ago as a collaborative research project with WMC, funded by an ARC Linkage grant. When WMC was taken over by BHP Billiton, the project continued, with BHPB sponsoring a second Linkage project that started work in 2008.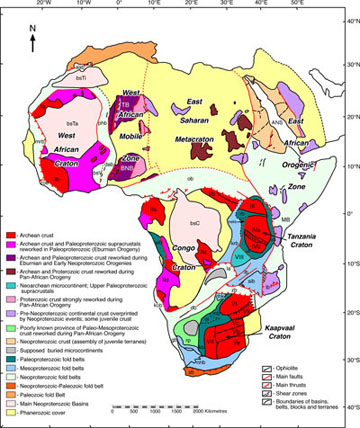
The GLAM project arose from WMC’s recognition that major ore deposits represent major transfers of mass and energy from the deep Earth, and that these fluxes require focusing by major, probably translithospheric, structures. This means that the most significant concepts and observations for predicting the localisation of giant ore systems are those related not to the deposit environment itself, but to the the much larger entity – the ore system. GEMOC was brought into the project because of our broad expertise in the composition, origin and structure of the lithospheric mantle.
Figure 1. Lev natapov’s new map of the basement geology of Africa.
The aims of the project are ambitious:
• To map the fundamental lithospheric architecture of the continents to depths of about 250 km
• To combine these maps with 3-D imagery and numerical dynamic modeling, to explore major geodynamic processes related to the formation and breakup of continents
• To test the relationships between lithospheric architecture, Earth dynamics and the localisation of large ore deposits
The expected outcomes include maps of lithospheric architecture at three levels:
0-100 km, 100-175 km and 175-250 km, and 3-D visualisations of selected regions (see cover). The construction of these maps is proceeding through several stages, which can be illustrated by our recently completed analysis of Africa (see GEMOC Publication 547).

(1) A new tectonic analysis of each target area, integrating crustal geology, geochronology and tectonics. This is based on an exhaustive literature review, using resources from GEMOC (especially Lev Natapov), the industrial sponsor, and independent consultants for specific areas. Where existing geochronology is inadequate, GEMOC’s TerraneChron® technology is being deployed to provide new information on crustal genesis in key areas, and in particular to distinguish areas/periods where new crust was generated, or older crust was reworked. Our new map of Africa (Fig. 1) shows the type of information that is assembled and digitised in this first stage.
Figure 2. The tectonothermal map of Africa – see text for explanation.
(2) A map is prepared showing upper lithospheric domains (crust + uppermost mantle, to ≈ 100 km). The boundaries of these domains are defined on the basis of geology, topography, gravity, magnetics and derivatives of these. Using geochronological and geological data from the first stage, each domain is classified in terms of its origins and subsequent tectonic history. In Figure 2, Archons (A) are volumes of the upper lithosphere that were formed before 2.5 Ga ago, and have escaped significant reworking since 2.5 Ga. Protons (P) are volumes generated between 2.5 and 1.0 Ga; Tectons (T) are younger than 1.0 Ga. It is especially important to recognise episodes of tectonothermal reworking; thus Archons reworked in Proterozoic time are shown as P/A, Protons reworked since 1.0 Ga become T/P, and so on. The definition of these domain boundaries is a key element in building a predictive model; Africa alone contains ca 200 upper lithospheric domains. The map in Figure 2 is a simplified version of the working files, lumping together adjacent domains with similar classifications.
Figure 3. Vs tomographic image of the Kalahari Craton and surroundings; red to white colours show high Vs; yellow to green shows low Vs. The Chemical Tomography sections were constructed using mantle-derived xenocrysts from kimberlites; note none sample the core of the high-velocity root.
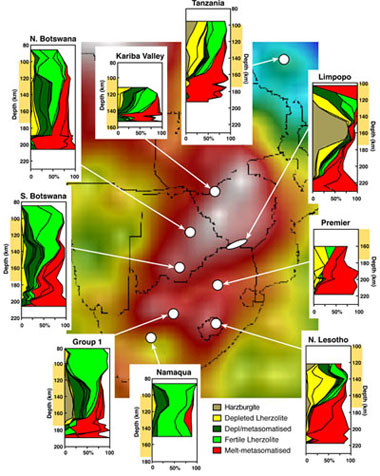
(3) Lower lithospheric domains (100-175 km) are mapped, using a combination of seismic tomography and mantle petrology. The primary dataset is a global Vs tomographic model, generated by Prof Steve Grand (Univ of Texas, Austin) and enhanced through regridding and 3-D interpolation by WMC/BHPB geophysicists to provide exceptional resolution (see Research Highlight). This dataset is supplemented wherever possible with information derived from studies of mantle-derived xenoliths in kimberlites, basalts and other deep-seated igneous rocks. The interpretation of the seismic data in terms of mantle composition, and by inference its age, has made significant progress during the project (see GEMOC publication #548). New Re-Os studies are being carried out on xenolith suites from a variety of areas to nail down mantle history in some contentious areas. Beneath Africa (Fig. 3) this approach has allowed the division of the subcontinental lithospheric mantle (SCLM) into volumes that are classified in the same way as the upper lithospheric domains. This analysis has outlined three major blocks of highly depleted Archon SCLM, surrounded by relatively narrow zones that have been reworked/refertilised during Proterozic time (and probably later). A major conclusion from the African study has been that much of the SCLM beneath upper lithospheric domains classified as P/A, T/A or even T/P represents strongly reworked Archean SCLM.
(4) Next, the project attempts to outline and classify lower 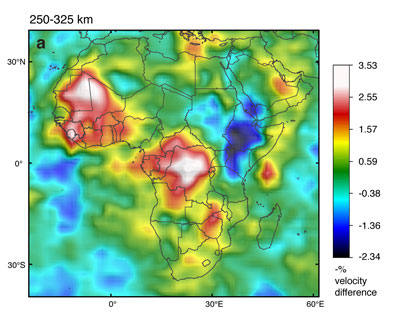 lithospheric domains (175-250 km). This process integrates the seismic tomography and mantle petrology to map the depth of the “lithosphere-asthenosphere boundary” – which beneath cratonic areas, at least, may simply be a zone of intense melt-related metasomatism (see GEMOC Publication #409). 2-D cross-sections (Fig. 4) and 3-D images of Vs isosurfaces in the tomography (see cover) emphasise the deep roots beneath some cratonic areas, the steep sides of these highly depleted volumes, and the highly variable depth of the “lithosphere-asthenosphere boundary”.
Figure 4. Section through the seismic tomography model for 250-325 km depths, showing robust roots under West African and Congo cratons, but only remnants beneath the Kalahari craton. For the full 3D model, see cover.
(5) The maps are then interpreted in terms of mantleprocesses: the primary origin of the SCLM in each domain, the location and nature of zones of mantle reworking, the tectonic environments along domain margins through time,and the “event limits” of events such as mantle plumes that have affected the SCLM. The integration of these datasets and maps results in 4-D event charts for each continental landmass, derived from the history of both mantle and crustal domains. The principle can be illustrated by a cartoon showing the changingrelationships between the different domains of Africa through time (Fig. 5). This analysis emphasisesthat Africa is made up of several major blocks, some of which have repeatedly joined and separated along some clearly recognisable domain boundaries. These major translithospheric structures then become major foci for exploration targeting.
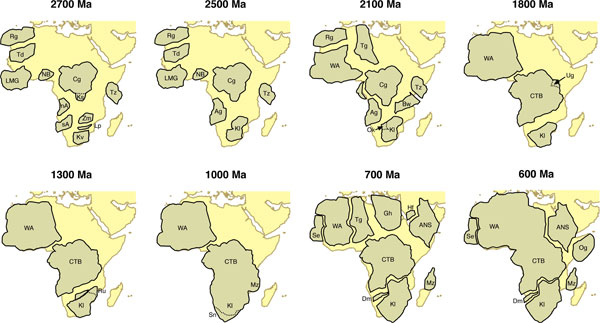
Figure 5. The assembly, breakup and reassembly of Africa’s building blicks through time.
In the new GLAM project, numerical modeling will be used to explore how and why domain boundaries open and close, how continents extend or deform during collisions, and what mechanisms lead to the extension of some cratons out under ocean basins, and the incorporation of ancient SCLM relics beneath the Atlantic ocean (Research Highlight, p31).
A specific aim is to incorporate realistic temperature- and depth-dependent rheology for the SCLM and the convecting mantle, and realistic strain-weakening mechanisms.
Key questions remain: why do some domains and boundaries become the sites of large-scale mineralisation and others do not? Work is in progress to assess sites of preferential magma/fluid flow along lithospheric discontinuities, the differing fertility of lithospheric domains, and how heat distribution in the lithosphere controls magmatism and hydrothermal circulation.
Ultimately, the products of the GLAM project will be collated into an atlas, accessible online.
Contacts: Sue O’Reilly, Bill Griffin, Graham Begg, Jon Hronsky
Funded by: ARC Linkage, ARC Discovery, WMC Resources, BHPB, international collaborators.
Ancient lithosphere blobs beneath the oceans: spelling out the geochemists’ alphabet
The nature of continental archean lithospheric mantle
Archean subcontinental lithospheric mantle (SCLM) is distinctive in its highly depleted composition, commonly strong stratification, and the presence of rock types (e.g. depleted, low-Fe harzburgite) absent in younger SCLM (see GEMOC Publications #90, #132, #234, #485, #542). Primary (unmetasomatised) Archean lithosphere is very low in basaltic components such as Al, Ca, Fe, consists dominantly of dunite and Ca-poor harzburgite and has high seismic wave velocities, mainly due to the high proportion of Mg-rich olivine (Fo 92-94). Archean lithosphere is significantly less dense than asthenosphere at any depth, and this buoyancy means that it cannot be gravitationally delaminated; it needs mechanical disaggregation
(e.g. rifting) and/or metasomatic reworking to be disrupted.
Figure 1. Tomographic model images at three depth slices for the Atlantic Ocean Basin (see text for details of the model). Note that “hot” (red-white) colours indicate higher velocities and cool colours lower velocities. Relevant OIB Provinces are: 1, Azores; 2, Madeira; 3, Canary Islands; 4, Cape Verde; 5, Fernando de Noronha; 6, Ascension Islands; 7, St. Helena; 8, Trindade; 9, Tristan da Cunha (Walvis Ridge at ~130 Ma; Richardson et al., 1984); 10, Bouvet; 11, Crozet Archipelago (Afanasy – Nikitin Rise in the Indian Ocean at Late Cretaceous, ~115-80 Ma; Mahoney et al., 1996) ); 12, Cameroon Line. For more detail see GEMOC publication #576.
Oceanic archean mantle revealed in tomographic models
Figure 1 shows tomographic slices through the oceanic lithosphere and upper mantle of the Atlantic Ocean Basin at 0-100 km, 100-175 km and 175-250 km.
In the 0-100 km section, high-velocity regions are obvious. Some are apparently continuous with continental regions (especially off southwestern Africa and southeastern South America) and some occur as discrete “blobs” within the ocean basin, from the continental margins to the mid-ocean ridge. In the layer from 100-175 km, these fast domains persist, and some also show velocity contrasts in the 175-250 km layer.
A traditional interpretation for high-velocity regions at the margins of ocean basins is the effect of cooling of the oceanic lithosphere with time and distance from the ridge. However, this cannot be the explanation for the discrete blobs that lie within the ocean basin, both away from the original rift margins and near the present-day ridge, with some extending to depths of 250 km.
We suggest that these high-velocity volumes represent remnants of depleted (buoyant), ancient continental lithosphere, fragmented and stranded during the rifting process at the opening of the ocean basin. The high-velocity domains extending out from the coastlines are not uniformly distributed along the basin edge. The most marked high-velocity regions, off SE South America and northwest and southwest Africa, appear to be continuous with their respective continental deep structure as seen in the tomographic models. The new global magnetic-anomaly map (Fig. 3) shows that these regions have a complex magnetic signature that is consistent with extended continental crust, and distinct from that of oceanic lithosphere, which is characterised by the regular magnetic striping produced at spreading centres.
Figure 2. Modified extract from the global magnetic anomaly map (Korhonen et al., 2007. Magnetic Anomaly Map of the World Scale: 1:50,000,000, 1st edition, Commission for the Geological Map of the World, Paris, France) showing the Atlantic Ocean Basin and Atlantic coasts of South Africa and South America. Black lines outline the regions with crustal rather than oceanic magnetic characteristics (modified from GEMOC publication #576).
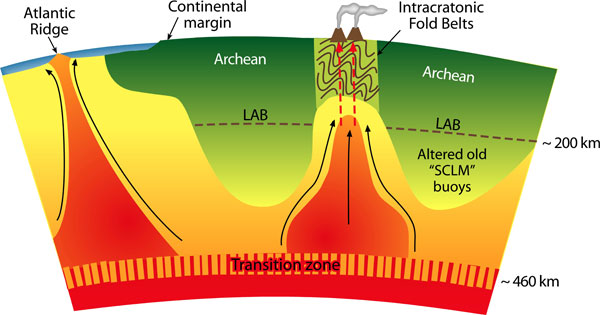
Old Re-Os ages for mantle sulfides in some depleted mantle rock types beneath rift zones and oceanic areas (see references in GEMOC Publication #576) suggest that these high-velocity blobs (inferred to have high Mg# and low density) represent relict Archean to Proterozoic SCLM (now refertilised to varying degrees, during episodes of mantle fluid inflitration reflecting larger-scale tectonic events) that was mechanically disrupted and thinned during the formation of the oceanic lithosphere. This interpretation implies that ocean basins do not form by clean breaks at now-observed continental boundaries, but that significant volumes of buoyant old mantle are embedded within the newly generated oceanic lithosphere. The opening of ocean basins may be largely by listric faulting mechanisms, leaving significant wedges of continental lithosphere at rifted margins, and stranding domains of ancient lithosphere in the upper part of the new oceanic crust-mantle system, where they would remain as buoyant blobs.
If the higher-velocity coherent blobs observed at depths up to >150 km in the upper mantle of the Atlantic Ocean do represent remnant Archean mantle roots, this has important implications for the nature of global convection. Models involving large-scale horizontal movement would be difficult to reconcile with these observations. Instead, convection may be dominantly in the form of upwelling vertical conduits with shallow horizontal flow (Fig. 3). The locus of these conduits may be controlled by the geometry of the margins and the coherence of the buoyant lithospheric blobs.
Figure 3. Cartoon indicating how high-Vs (low-density), vertically coherent regions extending to up to > 250 km could control convection pathways (modified from GEMOC publication #576).
Ocean island basalt goechemical signatures
The localised persistence of ancient SCLM beneath oceans also provides a logical explanation for the “alphabet soup” of mantle sources created by geochemists to describe the isotopic signatures of basalts (EM1, EM2, HIMU, DMM; Fig. 4). These components are generally attributed to different geochemical reservoirs within the convecting mantle. However, all of these geochemical fingerprints are found in lithospheric material and have been well characterised in mantle xenolith studies (e.g. GEMOC publications #60, #219). If lithospheric volumes persist to deep mantle levels (>150 km) in ocean basins, then interaction with upwelling mantle plumes can “contaminate” magmas and fluids (Fig. 3), imposing a range of isotopic and trace-element signatures. A detailed examination of the ocean-island database from the Atlantic shows a strong correlation between “continental” signatures (EM1, EM2, etc) and the presence of high-velocity blobs in the seismic tomography (see GEMOC Publication #576).
 This model removes the requirement for hidden source regions embedded within the convecting mantle. Magma interaction with deep ancient SCLM roots also provides a simple explanation for observations such as Archean Re-depletion model ages in oceanic basalts.
Contacts: Sue O’Reilly, Ming Zhang, Bill Griffin
Funded by: ARC Discovery, Macquarie external collaborative grants, ARC Linkage, BHPB
Figure 4. Isotopic components commonly observed in basaltic magmas and their fields in Nd and Sr isotopic space (for more detail see GEMOC publication #576).
Isotopic variability in mantle sources: the melt percolation recipe
Mantle rocks that outcrop at the earth’s surface provide direct information on the composition and evolution of the Earth’s mantle. The isotopic systematics of most peridotite massifs and mantle xenoliths show a wide range of variation compared with single suites of mantle-derived lavas. Some of the isotopic variations observed in peridotite massifs are correlated with lithology, e.g. pyroxenites vs peridotites, and have been ascribed to convective mingling of subducted material with pristine material. Other small-scale heterogeneities have been ascribed to time-integrated enrichment in radioactive parent elements by percolating melts/fluids, superimposed on previously depleted rocks.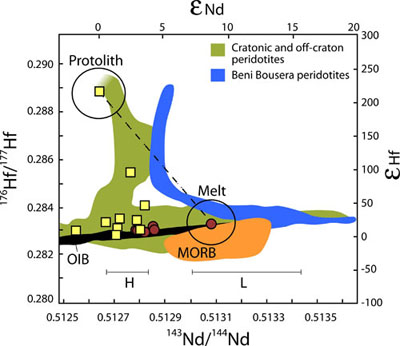
However the “instantaneous” (as opposed to “time-integrated”) effect of melt transport on isotopic systematics is usually neglected, although it may theoretically generate drastic fractionation of daughter elements from different isotopic systems. Under the temperature conditions of the lithosphere–asthenosphere transition, diffusional processes may be slow, and therefore chemical and isotopic equilibrium between minerals and percolating melts may not be reached.
Figure 1. Hf and Nd isotopic variations at the melt percolation front in the
Lherz massif.
This type of disequilibrium has been observed in the Lherz massif, the type locality of lherzolite, located in the French Pyrenees. The lherzolites have been shown to be secondary products, produced when melts refertilised a depleted harzburgite matrix (see Annual Report 2007; GEMOC Publication #544). The transition zone between the harzburgites and the refertilised material represents a frozen melt-percolation front that moved through the subcontinental lithospheric mantle. Isotopic signatures at the melt percolation front show a strong decoupling of Hf from Nd isotopes (Fig. 1). This decoupling cannot be accounted for by simple mixing involving the harzburgite protolith and the percolating melt (dashed line between the two circled end-members), nor by the unlikely presence of OIB-type melts at the contact, nor by a chromatographic effect.
Using one-dimensional percolation–diffusion and percolation–reaction models, we can show that these signatures represent transient isotopic compositions generated by porous melt flow (Fig. 2).
The isotopic heterogeneity observed in the transition zone between harzburgites and lherzolites can be reproduced with a realistic range of physical parameters: a melt fraction of a few percent, a percolation rate of several cm/year, percolation over distances of tens to several hundreds of meters. The Lherz example suggests that a large range of isotopic signatures may be generated at a melt percolation front, depending on chemical diffusion, isotopic homogenisation and peridotite-melt compositions. Full details are given in GEMOC Publication #558.
Therefore, under certain circumstances, melt-rock interactions can generate enriched, “intraplate-like” isotopic signatures in the transition zone between the two contrasting components. These results suggest that some of the isotopic signatures of mantle-related rocks could be generated by diffusional processes associated with melt transport.
Contacts: Véronique le Roux, Sue O’Reilly, Bill Griffin
Funded by: ARC Discovery, LIEF, MQRES, INSU DYETI Program, French Ministry of Research, Bourses Lavoisier
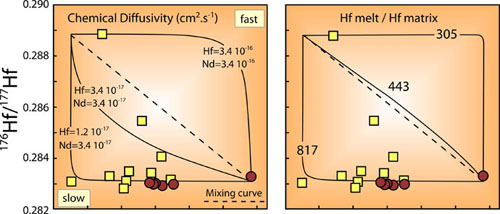
Figure 2. Modelling showing the importance of chemical diffusion and element concentrations, among other parameters, in the process of isotopic re-equilibration during percolation. Small variations in these parameters may generate a large range of isotopic variations.
Application of 186Os to geochemistry and cosmochemistry
187Re-187Os isotope geochemistry has gained widespread utility in the geosciences over the past decade. Applications in studies of the mantle, ore deposits, organic rich sediments and meteoritics testify to the diversity of problems that can be tackled with this technique. However, another radiogenic Os isotope (186Os) is formed by the decay of 190Pt. This decay scheme has not been widely applied as it is technically exceedingly challenging to measure 186Os anomalies. This is due largely to the combination of two factors; the half life of 190Pt is ~430 billion years (ca 30 times the age of the universe) and 190Pt makes up only 0.01296% of naturally occurring Pt. Therefore the amount of radiogenic 186Os on the Earth is very small, and to detect any ingrowth due to this decay, we must use geochemical reservoirs that have had very high Pt/Os ratios for long periods of time. Historically the only such terrestrial reservoir was considered to be the outer core, but geochemists are increasingly recognising the presence of 186Os anomalies in other terrestrial materials, such as sulfides in the lithospheric mantle.
Over the past two years, GEMOC has been attempting to establish a protocol for 186Os analyses on the Triton TIMS housed in the GAU. Refinements in loading and acquisition routines have resulted in an increase in internal precision on individual analyses by an order of magnitude to ± 0.0000025 on 20 ng sample loads, a precision equivalent to that achieved by other groups conducting such work. However, this precision has been achieved on smaller sample sizes than other groups are using routinely.
With this capability we can investigate a large range of earth science problems. For example, preliminary data from Proterozoic organic rich sediments tantalisingly suggest that there may be a significant crustal reservoir of 186Os which has been hitherto ignored in investigations involving potential contributions to plume derived basaltic magmatism (see cartoon). Furthermore, there is the potential to integrate the Pt-Os technique with 187Os isotopic data to map out distinct lithological domains in the mantle, providing another aspect to the debate regarding the relative role(s) of the subcontinental lithospheric mantle, the asthenosphere and recycled components in mantle plumes. Finally, Pt-Os studies of differentiated meteorites can place independent constraints on the timing and rates of core formation and segregation during planetary formation. We anticipate that 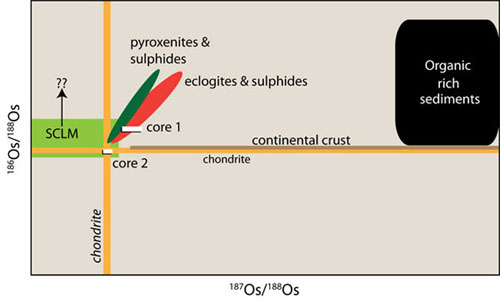 with further refinements in both chemistry and mass spectrometry, GEMOC will become the first laboratory in the Southern Hemisphere to routinely apply this technology, and will become a world leader in its application.
Contact: Bruce Schaefer
Funded by: Monash University, Macquarie University
Cartoon illustrating the variation in 186Os and 187Os isotopes in different terrestrial reservoirs. The two core compositions are for different model Re-Pt-Os ratios dependent on partition coefficients. SCLM = Subcontinental lithospheric mantle.
Journey in time and space beneath Kimberley South Africa
The “4-D” lithospheric mapping methodology developed at gemoc describes the vertical and lateral variation in lithospheric mantle chemistry using mantle xenoliths or xenocrysts carried to the surface in volcanic eruptions. Where more than one episode of magmatism occurs in the same area, this methodology also can provide insights into the temporal evolution of the lithosphere. 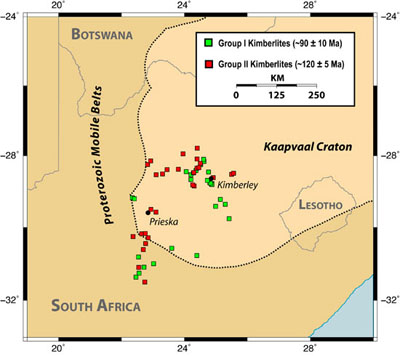 The Kaapvaal Craton in southern Africa is an ideal natural laboratory for this methodology because many kimberlites provide samples of the lithospheric mantle. The Kimberley area in particular contains kimberlites that have erupted during two episodes of magmatism, the first at approximately 120 ± 5 Ma (Group II kimberlites), and the other at approximately 90 ± 10 Ma (Group I kimberlites). The spatial coincidence of kimberlites with different ages provides samples of the lithospheric mantle during each eruptive episode; comparison of these samples tracks the chemical evolution of the lithospheric mantle during this interval (Fig.1).
Figure 1. Cretaceous age kimberlites of the Kimberley area, South Africa.
Peridotitic garnet xenocrysts are a common component of kimberlites and are collected extensively in diamond prospecting. Application of the garnet geotherm method to suites of garnets from each kimberlite in Figure 1 places these grains in a depth context, and gives a “train” of garnets below each kimberlite, similar to a vertical borehole (Fig. 2). In addition to temperature information, the garnets also contain information on depletion and metasomatism processes in the mantle, which is the basis of chemical tomography.
Previous applications of chemical tomography have involved constructing a local paleogeotherm and then plotting garnet-derived geochemical signatures as a function of depth for each locality considered. A natural extension of this method is to correlate the compositional and metasomatic signatures across multiple localities, to derive the three-dimensional distribution of rock types and metasomatism in the lithospheric mantle.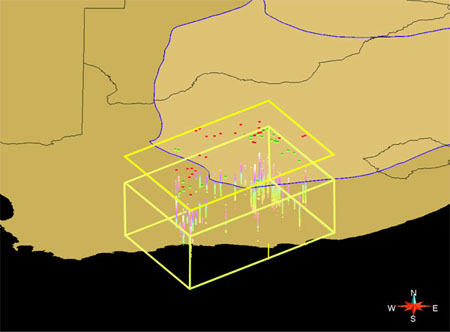
Figure 2. Perspective view toward the north of the volume sampled by the kimberlites of the Kimberley-Prieska area. The red and green squares are the same kimberlites shown in map view above, and the blue line indicates the extent of the Kaapvaal Craton. The box below the map surface indicates the volume of interest and ranges in depth from 50 to 250 km. In this volume the individual garnet xenocrysts are plotted at their calculated depths, with hotter colours indicating greater depth. The yellow rectangle indicates where the box would intersect the surface if projected upward. The angle of perspective is approximately 45º above the horizon.
We have mapped several measures of depletion and metasomatism throughout the mantle volume sampled by kimberlites in the Kimberley-Prieska region using the Discrete Smooth Interpolation algorithm. Values for the older and younger group of kimberlites were estimated separately. One of these measures is shown in Figure 3.
Highly magnesian olivine (XMg > 0.925) is thought to represent ancient melt-depleted cratonic mantle; values less magnesian than this probably reflect later metasomatic modification. The marked shrinkage in the volume of highly magnesian mantle in the interval between the eruption of the Group II and Group I kimberlites indicates that a significant metasomatic event during this interval added iron to the mantle. This metasomatism is probably the result of interaction of the depleted mantle with mafic silicate melts (see GEMOC publications #522 and #578). The timing of this metasomatic event (120-90 Ma) suggests that it is related to changes in the regional stress field associated with the opening of the southern Atlantic Ocean.
Contacts: Alan Kobussen, Bill Griffin, Sue O’Reilly
Funded by: De Beers, ARC Discovery (O’Reilly, Griffin et al.), iMURS/IPRS (Kobussen)
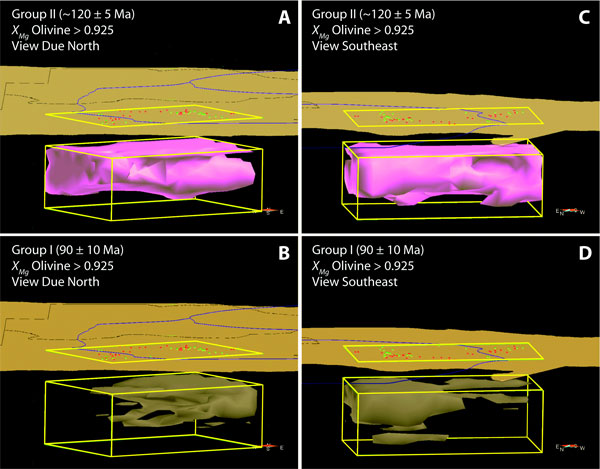
Figure 3. Perspective views of isosurfaces of XMg olivine resulting from the DSI algorithm. Areas within the shaded volumes have XMg >0.925 (a depleted peridotite composition) and areas outside have less. (A) The view due north of the volume resulting from interpolation using garnets from the Group II kimberlites. The angle of perspective is now approximately 15º. Map symbols are the same as Figure 2. (B) The same view and perspective as (A), but this time using the garnets from the younger Group I kimberlites. (C) The same volume as in (A), but viewed toward the southeast. (D) The same volume as in (B), but viewed toward the southeast.
You can't judge a granite by its colour
Granites form a significant part of the continental crust, yet their origin and the relative contribution of crustal and mantle-derived components to these rocks has long been hotly debated. The classification of granites into “I-type” (igneous), “S-type” (sedimentary) and “M-type” (mantle) in the 1970s went some way to recognising mineralogical and bulk-rock chemical differences that reflect source-rock characteristics. A number of studies have focussed on experimental and numerical modelling related to silicic magma generation and the ultimate source and level of magma generation. These studies have shown that both felsic residual melt fractionated from injected basalt and partial melt derived from crust adjacent to the injected basalt can be present under certain conditions in the crust.
Figure 1. Simplified geological map of the Walcha Road zoned pluton and Back Creek stock, Moonbi supersuite. (a) Contour intervals for colour index; (b) K-feldspar megacryst abundance. In general the foliation, as defined by mineral elongation, follows the contact margin and contour lines. The foliation, in general, dips steeply inwards. The monzogranite pluton is zoned from a mafic margin to two felsic central zones, one around Congi and the other around Campbells Hill (modified from GEMOC publication #555).
The development of in situ Hf-isotope analysis in the MC-ICPMS laboratory at GEMOC (GEMOC publication #179) allowed reliable single-grain Hf-isotope analysis of zircon to determine the degree of 176Hf/177Hf variation within a zircon population. This technique can be applied on the scale of a hand specimen, and then extended to the pluton scale and ultimately to the total variation within a supersuite of plutons. The 176Hf/177Hf ratio of a magma, and hence of the zircon crystallised from it, is a reflection of the source(s) of the magma. Higher ratios reflect more juvenile (mantle-derived) source rocks, and lower ratios the involvement of older material (either mantle or crust). The zircons thus can record the sources of individual magma batches that went into the construction of a single pluton, or a batholith (GEMOC publication #251).
Single-grain zircon analyses on the large zoned Walcha Road pluton (249±3 Ma) in northern NSW (GEMOC publication 555) have revealed that it represents a mixture of (1) magmas derived from Neoproterozoic lower crust (I-type) and (2) residual silicic magmas (M-type) of Late Palaeozoic age (Fig. 1). The central part of the pluton has the most M-type signature, as shown in the plot of
176Hf/177Hf ratios (Fig. 2). Significantly, the mantle-derived melt component in the felsic centre of the Walcha Road pluton is silicic, rather than mafic. Wider studies have shown this to also be the case for the voluminous leucocratic Stanthorpe granite in the northern part of the batholith.
These results highlight the danger of associating mantle-like isotopic values with the direct involvement of mafic magma. Because of the silicic composition of the residual and crustal partial melts, the mixed magma may not show the major textural and major element variations that result from mixing or mingling of felsic and mafic magmas that may be markedly different in temperature and viscosity (e.g. GEMOC Publication #251). Indeed, the mixing of silicic residual melts and crustal partial melts may be difficult to detect within single plutons, except by isotopic studies of zircon and other minerals that preserve isotopic disequilibrium.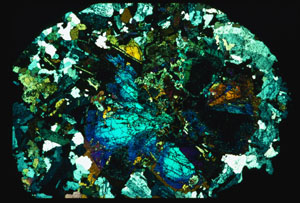
Photomicrograph of a mafic clot with radiating clinopyroxene glomerocryst overgrown by hornblende and plagioclase, magnetite ± biotite, sampled near location FS828 (see Fig. 1)
Powell and O’Reilly (GEMOC publication #419), used Re-Os analyses of sulfides in mantle-derived peridotite xenoliths from basalts, to establish that parts of the lithospheric mantle below the New England area are at least Proterozoic in age. The Hf model ages for the older component in the Walcha Road pluton indicate the presence in the lower crust of rocks as old as Neoproterozoic. The integration of these two data sets suggests that New England may represent a microcontinental block, with a Proterozoic mantle lithosphere overlain by Proterozoic lower crust (see GEMOC publication #555).
Contacts: Dick Flood, Stirling Shaw
Funded by: Macquarie University
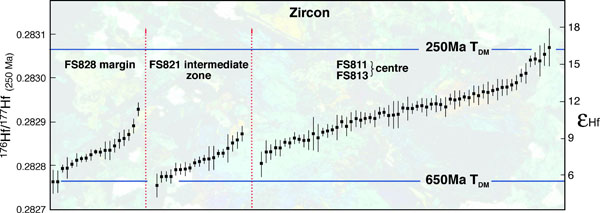
Figure 2. Plot of 176Hf/177Hf and εHf (250Ma) for zircons from the margin, intermediate zone and centre of the pluton. Error bars for individual measurements are 1SE. Data arranged in direction of increasing 176Hf/177Hf. Lu-Hf TDM model ages at 650 and 250 Ma are shown (modified from GEMOC publication #555).
“Decratonistion” of North China - a Mesozoic event
Cratons are old, stable parts of the continental crust that have survived at least since Proterozoic time and have not undergone strong magmatism or tectonism since their stabilisation. They owe much of their stability to thick roots of highly depleted peridotitic lithospheric mantle. Early in the 1990s it became apparent from studies of mantle xenoliths that the lithospheric root beneath the eastern half of the North China Craton (NCC) had been severely modified; a typical Archean root sampled by Paleozoic kimberlites had been largely replaced by a thinner, hotter and more fertile lithospheric mantle more typical of Phanerozoic mobile belts. Since those early days, the lithospheric mantle beneath the NCC has been the focus of increasingly intense research efforts, involving both petrological and geophysical studies. GEMOC and our Chinese collaborators have played a major role in this effort (see GEMOC Publications #64, 113, 225, 339, 384, 490, 493). Now studies of crustal rocks are providing new insights into the processes that have modified the roots of the NCC (see GEMOC Publication #512).
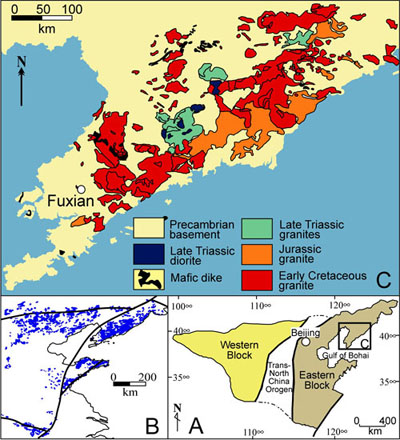
Figure 1. A: Simplified map showing major tectonic units in North China craton B: Distribution of Mesozoic intrusions in eastern North China Craton. C: Geological map showing distribution of Mesozoic intrusions in Liaodong Peninsula (modified from GEMOC publication #512).
The crust of the NCC consists of several blocks of Archean rocks, stitched together in Paleoproterozoic time (1.8-1.9 Ga). The Liaodong Peninsula in the NE part of the NCC (Fig. 1) contains large volumes of Mesozoic igneous rocks, with widespread metamorphic core complexes and pull-apart basins. Hf isotope compositions of magmatic zircon grains (Fig. 2) indicate that the formation of the Mesozoic granitoids involved extensive partial melting of ancient crust. Most of the zircons from Triassic, and especially Jurassic, granitoids have εHf values <0, and could be derived from a variety of older mafic to felsic lithologies, which could be either Archean or Proterozoic in age. Many of these granitoids also contain inherited zircons with Archean to Paleoproterozoic ages. Similar low εHf values occur in Cretaceous granitoids, but these also show a range of positive εHf, up to values typical of the convecting mantle. These large ranges imply significant input of a mantle component, via magma mixing and crustal assimilation.
The abundance of Mesozoic magmas, like the Tertiary basaltic volcanism, indicates that the NCC is no longer a craton in the usual sense of the term, and that the “decratonisation” of the NCC began at least 210 Ma ago. The dominance of the older crustal components in the early Mesozoic magmas suggests that the process began with heating and melting of the lower crust; heat was provided by thinning of the lithosphere and upwelling of the asthenosphere. Mantle-derived magmas may have been involved as well, but their geochemical signatures have been strongly diluted by interaction with crustal melts. The stronger juvenile signature in the Cretaceous magmas suggests that, by ca. 125 Ma, increasing degrees of extension allowed asthenosphere-derived magmas greater access into the crust, where they could mix with melts derived from the older crust. This process has continued to the present day, culminating in Tertiary to Holocene alkali basaltic magmatism (see GEMOC Publication #490). The North China Craton survived as a coherent block for at least 1.5 b.y.; its decratonisation may be related to major plate-tectonic processes, including both the Triassic collision between the NCC and the Yangtze Craton, and the subduction and rollback of the Pacific plate beneath the area.
The data from the Mesozoic granitoids in the NE part of the NCC give important clues to how a cratonic root might be destroyed by the extensional processes that may accompany subduction beneath a cratonic block. However, many other Archean cratonic blocks have survived repeated episodes of subduction, collision and breakup, with their roots intact (see Research Highlight on GLAM project).
Why was the NCC different? The answer may lie farther back in time. Although much attention has focussed on the evidence for an Archean lithospheric root that was sampled by Ordovician kimberlites, those data represent only two limited areas in the eastern NCC. Extensive studies of Os-isotope systematics in mantle xenoliths from other parts of the NCC, using analyses of both sulfides and whole-rock samples, have found little evidence of Archean mantle, but widespread Proterozoic model ages (see GEMOC Publication #490). Perhaps the roots of many of the Archean fragments that were swept into the Proterozoic assembly of the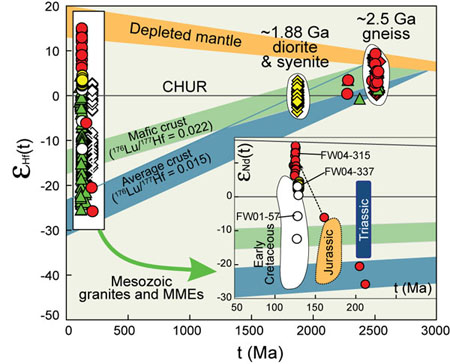 NCC had already been severely modified in that process, leaving the NCC with a less robust lithospheric root than most cratons. This could have left it more vulnerable to extension and further modification forces during the Mesozoic collision-subduction-extension events.
Contacts: Jin-Hui Yang, Bill Griffin, Sue O’Reilly
Funded by: Academica Sinica, ARC Discovery Grant, China NSF
Figure 2. Plot of εHf(t) versus inferred crystallisation age of the magmatic zircons analysed in this study (published in Yang et al., 2007b, 2007c). CHUR—chondrite uniform reservoir; MME—microgranular microdiorite enclaves (modified from GEMOC publication #512).
Reading geological histories in garnets
During burial or subduction, rocks experience pressure and temperature (P-T) conditions that are different from those of their formation. In response, minerals react with each other to form new minerals or to adapt their composition to one that is more stable under the new conditions. Microstructural relations among minerals and mineral composition, especially where zoning is preserved, are therefore witnesses to the geological history of the rocks and can be used to assess their P-T-time path for geodynamic reconstructions.
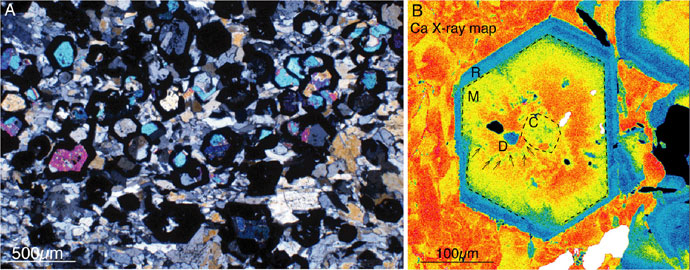
Figure 1. A- Photomicrograph (crossed nicols) of the microstructure of the eclogite; the black rings are “atoll garnet” grains, where a ring of garnet surrounds a cluster of other minerals. B- Ca X-ray map of a complete garnet (R: rim, M: mantle, C: core). The arrows point to a Ca-poor fracture in the garnet connecting the core and the matrix.
Garnet plays an important role in deciphering the history of metamorphic rocks because its composition can provide information about pressure, temperature and the timing of the metamorphism. Garnet is stable over a large range of bulk-rock compositions and P-T conditions. Its tight structure imposes relatively low diffusion rates on major elements and so garnet grains frequently preserve chemical zonation. A wealth of techniques has therefore been applied for deriving segments of P-T paths using the major-element composition of garnet. In addition, trace elements in garnet have been used to date metamorphic events either directly using the isotopic composition of garnet (Sm-Nd, Lu-Hf or Rb-Sr) or indirectly by linking the growth of datable accessory minerals, such as zircon or monazite, to that of garnet.
However, all the above techniques rely on the assumptions of (i) equilibrium between the growing garnet and the surrounding matrix and (ii) the closure of the rock to external chemical exchange, for example via fluids. It is therefore important to understand the processes
causing garnet zoning, acquired during garnet growth or during its re-equilibration. In the case of growth zoning, does it result from P-T or bulk-compositional changes? In case of
re-equilibration zoning, how fast and efficient is the re-equilibration process and what is the vector of the chemical exchange between garnet and matrix?
Figure 2. A- Photomicrograph of a cloudy garnet. B- δ18O profile of the garnet shown in A.
Three unusual types of garnet have been studied in terms of their microstructures and their chemical and isotopic zoning.
a) Atoll garnets in an eclogite: dissolution-reprecipitation in an open system at peak P-T conditions (Fig. 1).
The proposed model for atoll garnet formation involves growth of complete garnet grains along the prograde path. These complete grains display pronounced chemical zonation and numerous inclusions in the cores of the garnet grains. With changing P-T conditions, the inclusions break down (or react with their host), liberating water and creating minute fractures that cut across the garnet grains. These fractures allow infiltration of an external fluid phase, promoting (i) dissolution of garnet cores simultaneously with continuing growth at the outer margins of the grains, and (ii) growth of glaucophane porphyroblasts. Geothermobarometry using omphacite and phengite suggests that this process took place at peak P-T conditions (i.e. at about 20-25 kbar, 550°C), rather than during retrogression.
b) Coupled dissolution-reprecipitation: zoning in oxygen isotopes and major elements in cloudy garnet from a metapelite (Fig. 2).
Cloudy garnet crystals are interpreted to grow during the prograde path and to experience a re-equilibration at the temperature peak that essentially decreases the Ca content and δ18O of garnet rims. On the basis of textural arguments (pseudomorphism, and the existence of porosity and and a fluid-inclusion-free outer rim), garnet re-equilibration is explained by a process of coupled dissolution-reprecipitation. Such a process, although recognised in zircon or feldspar, has not previously been considered during re-equilibration of metamorphic garnet; it is attractive because it allows the re-equilibration of slowly-diffusing elements such as Ca and O. As a consequence, porosity appears to be an effective pathway for element exchange between garnet and the matrix.
c) Significance of oscillatory zoning in elongated garnet in an eclogite (Fig. 3).
Garnet shows an unusual orientation that defines the foliation of the eclogite. The “wings” of the garnets show oscillatory zoning in Ca. The proposed model for the formation of the elongated garnets includes (i) coalescence of several grains, (ii) plastic deformation of single garnet grains, and (iii) stress-induced dissolution-reprecipitation leading to anisotropic growth. Oscillatory zoning of major elements in garnet has previously been related to varying P-T conditions along the metamorphic path (Garcia-Casco et al., 2002). In this case, the effect of varying water pressure in the rock has been tested as an alternative hypothesis using thermodynamic modelling.
Contacts: Laure Martin and Michel Ballèvre
Funded by: ARC Discovery, CRPG-CNRS (Nancy, France), GEMOC
Figure 3. Ca X-ray map of an elongated garnet.
Deep drilling with basalts: over- and underplating of ancient crust in North China
Xenoliths carried up to the surface in deep-seated magmatic rocks provide us with windows into the composition and petrology of the deep crust and upper mantle, and tell us about processes at different depths in the Earth. It has proven much more difficult to get time constraints on these rocks – they are small, and often altered to the extent that conventional isotopic techniques give only ambiguous data. However, over recent years research with Prof Jianping Zheng, one of GEMOC’s co-workers, has shown that with patience and painstaking attention to detail, zircon can be separated from many of these xenoliths, even those with mafic to ultramafic compositions. In a series of studies, he has used this “deep drilling” approach to follow the development of both the subcontinental lithospheric mantle, and the deep crust. In 2008, this technique produced a unique record of crustal evolution in the Xinyang area, near the southern boundary of the North China Craton (GEMOC publication #519).
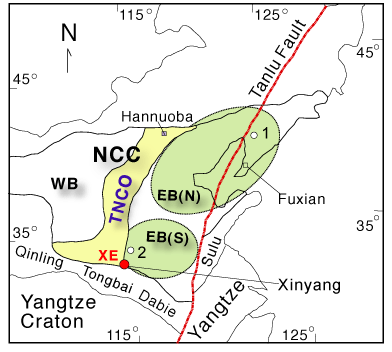
Figure 1. Major tectonic units in the eastern China: The North China Craton (NCC) is made up of the Western Block (WB) and the Eastern block (EB), which has two nuclei; these Archean blocks joined along the Trans North China Orogen (TNCO). The Xinyang xenolith locality lies on the edge of the southern nucleus (EB(S)), adjacent to both the TNCO and the Qinling-Tongbai –Dabie continental- subduction zone with UHP metamorphism.
The Mesozoic (~160 Ma) Xinyang volcaniclastic diatremes lie at the intersection between the Trans-North China Orogen and the Qinling-Dabie Orogenic Belt (Fig. 1), and carry a suite of xenoliths including mafic to felsic granulite, eclogite, meta-gabbro, pyroxenite and peridotite. The xenolith data show that the crust is temporally and compositionally zoned (Fig. 2). Whereas the oldest outcropping rocks are ca 2.85 Ga old, the upper part of the lower crust (to ca 30 km depth) consists of felsic granulites and rare pyroxenites that contain zircons with ages of 3.4-3.6 Ga. This “inverted stratigraphy” implies that the older crust was extensively resurfaced in Neoarchean time. The deeper (ca 30-45 km) parts of the lower crust consist of high-pressure (HP) mafic to felsic granulites and meta-gabbro, and the 207Pb/206Pb ages of most zircons in xenoliths derived from this deeper level are Paleoproterozoic (2.0-1.8 Ga). The presence of this younger layer beneath the 3.4-3.6 Ga crust suggests a major event of magmatic underplating. Hf-isotope data from the zircons (Fig. 2) indicate that this event involved both the addition of juvenile material (mafic granulites), and the remelting of older (3.0-3.8 Ga) rocks to produce intermediate to felsic granulites.
Important populations of Paleozoic (440-260 Ma) and Early Mesozoic (228-219 Ma) zircons are interpreted as representing metamorphic zircon growth in response to thermal/metasomatic events. Mantle-derived peridotite xenoliths contain dominantly Triassic (ca 230 Ma) zircons, but rare Neoarchean grain s record earlier metasomatic events in the subcontinental lithospheric mantle.
The xenolith suite thus records the growth and modification of the continental crust by overplating, underplating and metamorphism of an originally Paleo-Mesoarchean nucleus. Significant events reflected in the zircon record (Fig. 2) include at least:
1) initial formation of Paleo-Mesoarchean crust ; 2) formation of the upper crust in Neoarchean time; 3) assembly of the southern and northern parts of the Eastern Block of the North China Craton in Neoarchean time; 4) collision of the Western and Eastern Blocks of the North China Craton along the Trans-China Orogen in Paleoproterozoic time, with magmatic underplating and metamorphism in the lowermost crust; 5) subduction and collision of the Yangtze Craton with the North China Craton, which modified the lowermost crust and the upper mantle in Paleozoic and Early Mesozoic time.
This approach promises to provide many future surprises; results so far indicate that the lower crust may be significantly older than the upper crust in many parts of the world, and that the volume of ancient crust is greater than estimates derived from some models of crustal generation through time (e.g. GEMOC Publications #339, 354, 422).
Contacts: Jianping Zheng, Bill Griffin, Sue O’Reilly
Funded by: ARC Discovery, China NSF
Figure 2. Cartoon showing the collision and accretion events recorded in the zircons of the Xinyang xenoliths. The original 3.5 Ga crust has been magmatically overplated (2.85 Ga) and underplated (ca 1.85-1.6 Ga), and this composite crust has been affected by Paleozoic to Mesozoic continental collision(s).
Evolutionary histories of Earth and Venus - coupled convection-degassing models
Our understanding of the divergent evolutionary histories of Earth and Venus is hindered by the sparsity of geological record - particularly the oceanic crustal record - in the deep Precambrian, and the almost complete lack of geological context on Venus. The Venera, Pioneer, and Magellan missions have increased our knowledge of Venus' surface, but Venus shows no hallmarks of plate tectonics, so interpreting these features is difficult. Cratering counts suggest nearly the entire surface of Venus was created in one event ~750 million years ago. Analyses of surface samples by the Venera landers suggest a similar bulk composition and heat budget to Earth, so this lack of tectonic activity is puzzling. It has been suggested that since Venus is dry, it may lack the lubrication of near-surface faults that Earth has as a result of pore pressure or the hydrous alteration of minerals. This would result in significantly stronger faults, and may preclude plate tectonics, so that Venus is in an episodic-overturn regime in which the entire lid is periodically recycled; this is consistent with the cratering record.
Figure 1. Venus and Earth are sister planets in terms of size and composition, but have had markedly different tectonic histories, which are reflected in their atmospheres.
Episodic mechanisms have also been postulated for the Precambrian Earth, based on the episodic nature of the preserved crustal record. While the meaning of these peaks in preservation is debated, these periods in Earth’s history are also associated with massive volcanic, tectonic, and paleomagnetic disturbances. This has led to the suggestion that some episodic mechanism was at work in the distant past. Previous ideas focussed on mantle avalanches originating from instabilities in the mantle phase change at 670 km depth. Work at GEMOC (see publication #499, 2007) posited a new mechanism for episodic subduction, whereby the system stresses decrease with increasing heat production in the past, tipping Earth into an episodic overturn regime.
This model would imply that Earth went through a transition from episodic subduction in the early Precambrian, to modern plate tectonics as the planet cooled. The simulations also predict Venus may have in fact evolved from a stagnant-lid planet into an episodic regime, a suggestion that is at odds with traditional views of planetary evolution. It is consistent with the continental geology of Earth, but in the absence of an oceanic record, the evidence is equivocal. Furthermore, the absence of any record on Venus prior to ~750 Ma-1.2 Ga limits our geological insight into Venus' geodynamic evolution.
However, atmospheric compositions provide constraints on the history of volcanic degassing and the tectonic evolution of planets. Despite their superficial similarities, the atmospheres of Venus and Earth have evolved along significantly different paths. Without significant CO2 sinks on Venus, ongoing volcanism has resulted in the buildup of extremely high CO2 concentrations, which have contributed to the dehydration of Venus' surface. This dehydration, and the high surface temperatures, may contribute to the cessation of plate tectonics, as the reduction of water-weakening effects causes strong dry faults.
Venus' degassing history is to some extent recorded in its atmospheric argon signatures. Nonradiogenic 36Ar is ~80 times that of Earth. Since most 36Ar is primordial, this suggests very different initial atmospheric conditions for the two planets, with Venus retaining most of its initial atmosphere due to its fortuitous impact history. On the other hand, the deficit of radiogenic
40Ar (~24% escaped from the mantle, compared with ~52% for Earth), hints at a very different volcanic and tectonic history, particularly in the deepest past.
Mantle convection simulations performed at GEMOC hint at the tectonic factors behind these differences in the 40Ar deficits on Earth and Venus. By modelling mantle melting and argon partitioning and degassing under different tectonic regimes, we can show that mobile-lid convection is 1.8 times more effective than episodic overturn in degassing the mantle, and 20 times more efficient than stagnant-lid convection. Coupling these results with evolutionary models for volcanism and degassing allows us to test the sensitivity of atmospheric 40Ar abundances to tectonic evolution. Venus' argon budget is consistent with the planet having had stagnant-lid tectonics for the first 500 Myr of its history, and episodic overturn of the lid since then. It is not consistent with Venus having had plate tectonics for any significant portion of its history; this implies that Venus and Earth were never planetary twins but were very different planets from birth.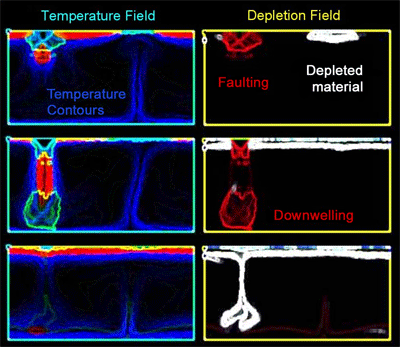
Earth’s atmospheric 40Ar deficit has often been attributed to hidden “unmixed” reservoirs in the deep mantle. However, the models show that this deficit can have a tectonic cause. The current 40Ar content of our atmosphere is consistent with episodic convection till the end of the Archean, and plate tectonics since then, in agreement with geological data and previous convection modelling. If Earth’s 40Ar deficit does indeed have a tectonic cause, then the corollary is that its atmospheric 40Ar budget is not consistent with Earth having had plate tectonics throughout the planet’s history.
Contact: Craig O’Neill
Funded by: ARC Discovery, MQ University
Figure 2. Time evolution of the temperature contours and depletion field for an episodic overturn simulation. Such a tectonic regime has been postulated for Venus today, and evidence suggests it has operated on Venus for the past 4 Gyr. Atmospheric and geological evidence suggest that it may have operated on Earth until the end of the Archaean, when it gave way to modern-style plate tectonics.
A guide to making high-magnesium andesites
Although the most primitive magmas from many arc volcanoes appear to be basaltic, there are a number of locations where primitive magmas are, or are inferred to be, more silica-rich andesites. Some of these are high-magnesium andesites with Mg# of around 0.7, which implies that such rocks are generated in, or equilibrated with, mantle peridotite under conditions that do not pertain beneath mid-ocean ridges. Geochemical data show that they did not form by slab melting. A review of experimental data on the melting of anhydrous peridotite showed that primitive high-Mg andesites also cannot be generated by anhydrous melting of lherzolite. A review of exisiting experimental data demonstrates that addition of H2O alone cannot explain the increases in both SiO2 and MgO contents (on an anhydrous basis) required to shift from basaltic to high-Mg andesitic melts in equilibrium with lherzolite residue. A much more plausible alternative is that these melts are extracted from a harzburgite residue. In order to study this further, experiments were performed at 0.6 GPa in the new high-pressure laboratories at GEMOC in which high-Mg andesitic melts were equilibrated with an olivine+orthopyroxene residue. The results showed (in the absence of H2O) that MgO and SiO2 contents increase in the ratio 2:1 as the degree of undersaturation in clinopyroxene increases. This is the right sign and magnitude of effect to explain the compositions of primitive high-Mg andesites. When the effects of H2O and clinopyroxene undersaturation were added together it was possible to obtain a line in Pressure-H2O space which describes the conditions under which a given high Mg-andesite could be in equilibrium with a harzburgite residue. Application to rocks from White Island (New Zealand), Amphlett Island (Papua New Guinea), Setouchi Belt (Japan), Mt. Shasta (USA), Adak Island and Piip volcano (Aleutians, USA) yield, for crustal thicknesses > 20 km, H2O contents of the melts of 2-8%, in generally good agreement with the available compositions of melt inclusions.
Contacts: Simon Turner, Bernie Wood
Funding: ARC Federation Fellowships

Photo: White Island volcano, New Zealand, where high-magnesium andesites erupted in 1977.
Multiple magma processes and TTG genesis
Geochemical studies tell us that tonalite-trondhjemite-granodiorite (TTG) plutonic complexes must be formed by partial melting of metabasaltic source material, but they cannot tell us the tectonic regime in which this crust was formed, nor how large volumes of TTG magma can be generated. A solution to TTG arc crust formation requires an interdisciplinary approach to resolve the tectonic setting (slab melt versus mafic lowermost crust sources), the time and length scales for melting and extraction, and the role of melt segregation mechanisms in the formation of both Archean TTGs and more recent adakite-like magmas. We have used an experimental approach that, when coupled with numerical models (Fig. 1), allows us to address some of these issues. The experiments are designed to reproduce the local changes in bulk composition that are predicted to occur in response to buoyancy-driven melt segregation along grain edges and the associated compaction of the solid residue. We observe changes in the melt composition and proportions of melt and solid phases between earlier direct partial melting (DPM) and the new segregation equilibration experiments (MSE) on metabasalt bulk compositions.

Figure 1. Felsic partial melt may segregate from a mafic host during buoyancy-driven compaction of the matrix (Jackson et al., 2005). Previous studies which suggested that this segregation mechanism is too slow (e.g. McKenzie, 1984) to yield large volumes of felsic melt neglected the chemical interaction between the melt and its matrix.
The MSE experimental results show distinct differences in the compositions of melts and solid phase and the stability of different solid phases when compared with the results from direct partial melting (DPM) experiments. The resulting melt compositions are lower in An and have higher Mg-numbers. Compared to DPM experiments, the MSE experiments show a significant reduction in hornblende and plagioclase abundances at lower temperatures (Fig. 2).
The results suggest that dynamic melt segregation and equilibrium processes may modify the modes, melt compositions, and geochemical indicators such as Mg-numbers. Both adakites and TTGs may form from partial melting of a hydrous mafic protolith, but their associated tectonic setting may be very different. This research does not support the hypothesis that links their petrogenesis through slab melting alone; nor models that require subsequent interaction of melts with the mantle wedge to increase Mg-number. The data from these melt segregation experiments demonstrate that it is possible to create variations in felsic melt compositions by partial melting and segregation processes within a mafic crustal underplate.
Contact: Tracy Rushmer
Funded by: Imperial College, UK; MQNSG
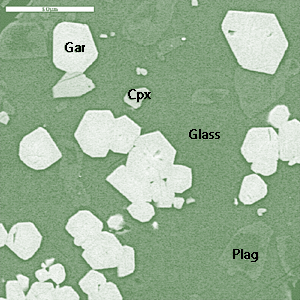
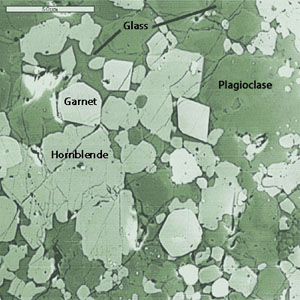
Figure 2. Comparison between direct partial melting of SC5 at 1.4 GPa and 975°C and MSE experiments.
(A): JP3 melted at 1.4 GPa and at 975C% with 15% melt composition at 50:50 and 2.5 wt% water added. The synthetic (anhydrous) glass composition at 15vol% is from this SC5-8 experiment. JP3 contains 64% glass, 17% plagioclase, 12% garnet, 6% cpx, and 1% ilmenite; no hornblende is present (Table 3). (B): SC5-8 is composed of hornblende (40%), plagioclase (40%), melt (glass) 15% and garnet 5%. Glass composition in SC5-8 is granodioritic with Mg number of 26; JP3 glass is also granodioritic but with Mg-numbers averaging 31.
Copper isotopes blaze the trail to hidden ore deposits
Two fundamental goals of mineral deposit research are to identify the sources of the metals and to understand the processes that have mobilised, transported and deposited them. To this end, geochemists have used several isotopic systems, including light stable isotopes (e.g. H, O and S) and radiogenic isotopes (e.g. Nd, Pb and Os). However, the stable isotope ratios of the metals themselves (e.g. Fe, Cu and Zn) may provide the most direct answers to these long standing questions. In the last decade, the development of multi-collector inductively coupled plasma-mass spectrometry (MC-ICP-MS) has made the high-precision measurement of metal stable-isotope ratios possible. This technique can analyse subtle variations in the stable-isotope ratios of metals in rocks and metal-bearing minerals, providing the economic geologist with a powerful new tool for investigating mineralised systems (GEMOC publication #527).
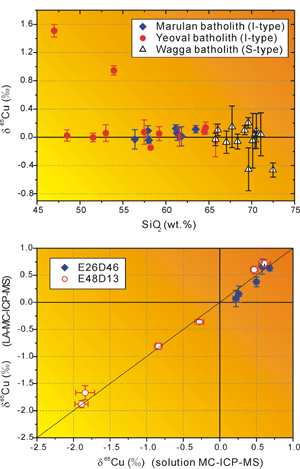
Figure 1. Variation of δ65Cu against SiO2 content for rocks from the Lachlan Fold Belt. Error bars denote 2 standard deviations.
Copper has two stable isotopes, and their ratio commonly is expressed in δ notation (δ65Cu = (Rsample/RNIST976-1)×1000 where R = 65Cu/63Cu). The main area of application of Cu isotopes to date has been the study of ore-forming systems. However, the baseline values of δ65Cu for different geological reservoirs (especially the crust) have not been well constrained, and this has been a major impediment to the interpretation of Cu isotope data. Furthermore, because mineralising systems influenced by low-temperature redox processes show much larger variations in δ65Cu than the high-temperature mineralising systems, there is no consensus on whether Cu isotopes carry useful information for interpretation of mineralisation processes.
Figure 2. Comparison of the Cu isotope data measured by LA-MC-ICP-MS and solution MC-ICP-MS.
We have carried out the first systematic measurements of the δ65Cu of granites (GEMOC publication #527). The chemical procedure developed at GEMOC has achieved quantitative recovery (100.6±1.6%), with a low total procedural blank (2.65±0.66ng) for Cu, allowing isotopic analysis of samples with as little as 10 ppm Cu. Well-characterised granites and related rocks from the Lachlan Fold Belt (LFB) in southeastern Australia were selected for analysis. The Cu-isotope ratios (δ65Cu relative to NIST SRM 976) of 32 rock samples, ranging from mafic to felsic compositions, from 3 batholiths (2 I-type, 1 S-type) from the LFB, vary from -0.46‰ to 1.51‰. Most of them cluster around zero, with mean values for the I-type and S-type granites of 0.03±0.15‰ and -0.03±0.42‰ (2 sigma) respectively (Fig. 1). These data, together with Cu-isotope ratios of two loess samples, provide preliminary evidence that the baseline δ65Cu of the crystalline part of upper continental crust is close to zero. The tight clustering of δ65Cu in rocks from the I-type suites suggests that high-temperature magmatic processes do not produce significant Cu isotope fractionation. However, two granites with abnormally heavy Cu-isotope signatures (δ65Cu up to 1.51‰) may have been affected by local hydrothermal alteration.
Copper isotopes also have been measured in sulfide minerals (chalcopyrite and bornite) from the Northparkes porphyry Cu-Au deposit in SE Australia by MC-ICP-MS and laser ablation MC-ICP-MS. The Cu-isotope data obtained by the two techniques are consistent (Fig. 2). The results from both methods show a variation in δ65Cu of hypogene sulfide minerals greater than 1 ‰. Significantly, the results from four drill holes through two separate ore bodies show strikingly similar patterns of Cu isotope variation with depth. There is a sharp down-hole decrease in δ65Cu from ~ 0.8 ‰ in the low-grade ore zones (or phyllic-propylitic alteration zone) to ~ -0.4‰ at the margins of the most mineralised zones (Cu grade > 1wt. %). In the high-grade cores of the systems, the δ65Cu values are more consistent at around 0.2‰ (Fig. 3). A number of hydrothermal processes, including diffusion driven by the Cu concentration gradient, precipitation of Cu sulfides from brine during cooling, partitioning of Cu into a vapour phase, and remobilisation of Cu by oxidising ground water during convection, may have contributed to the observed Cu isotopic variations (Fig. 3).
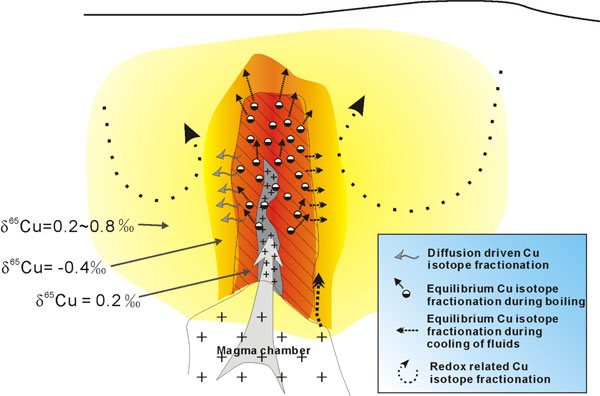
Figure 3. A summary of the pattern of Cu isotope variation in the Northparkes deposit and possible mechanisms of Cu isotope fractionation in a conceptual model for porphyry Cu deposits.
This work demonstrates that Cu isotopes show a large response to high-temperature porphyry mineralising processes, while the study on Cu isotopes in granites demonstrates that magmatic evolution does not produce significant Cu isotope fractionation. Taken together, these results suggest that Cu isotopes may be used as a vector to buried mineralisation.
Contacts: Weiqiang Li, Norman Pearson, Simon Jackson, Sue O’Reilly
Funded by: Macquarie University iMURS, ARC Discovery, MQ PGRF
Re-Os in sulfides tracks deep fluid interactions in old Spanish mantle
The Ronda Peridotite is the largest (∼ 300 km2) known exposure of subcontinental mantle peridotites. It is located in the Betic Cordillera of southern Spain, the westernmost segment of the Alpine belt in Europe. One of the most remarkable features of this orogenic peridotite massif is the transition from highly foliated spinel-peridotite tectonites (Fig. 1a) to relatively undeformed granular peridotites (Fig. 1b), separated by a recrystallisation front. Compositional variations across this narrow transition zone indicate that the granular peridotites were produced in Cenozoic time, when partial melts derived from upwelling asthenosphere percolated into the subcontinental lithospheric mantle (the spinel tectonite domain). The Ronda massif thus constitutes a natural laboratory where we can investigate the geochemical behavior of isotopic systems during mantle lithosphere-asthenosphere interaction. We have used in situ isotopic analyses of sulfide minerals in the peridotites to study the effects of melt percolation on the Re-Os system.
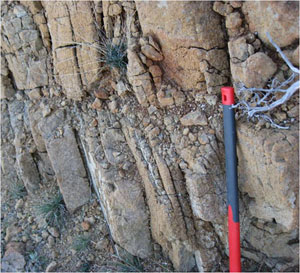
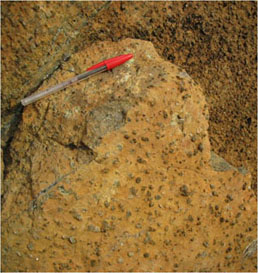
Figure 1. Field pictures of mantle peridotites from the Ronda spinel tectonite (a) and coarse-granular (b) domains.
Figure 2 shows that sulfides from both microstructural domains and the recrystallisation front show large ranges in Re/Os and Os-isotope composition. 187Re/188Os and 187Os/188Os in sulfides from the coarse-granular domain largely overlap with values in the spinel tectonites and there is no significant difference between the isotopic composition and variability of sulfides from these domains. However, some grains in samples at the recrystallisation front show an apparent decoupling between relatively high 187Re/188Os and low 187Os/188Os. These sulfides are probably products of refertilisation reactions induced by percolating melts at the front, which caused significant enrichment of Re 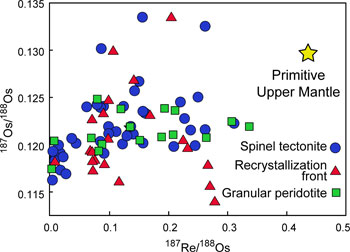 relative to Os. Aside from these effects, Re-Os systematics in the Ronda mantle peridotites apparently were largely unaffected by partial melting and melt transport induced by the Cenozoic lithospheric thinning, and mostly record more ancient tectonothermal events.
Figure 2. 187Re/188Os versus 187Os/188Os in sulfides from the Ronda peridotites.
Figure 3 shows the distribution of Re-depletion ages (TRD) in individual sulfides from the Ronda massif. TRD ages cluster around three main peaks: 1.6-1.8 Ga, 1.2-1.4 Ga, and 0.7-0.8 Ga. Sulfides with relatively high Os contents and low Re/Os have Re-depletion ages that coincide with the two most ancient Proterozoic peaks. These grains are probably residual after variable degrees of melt extraction from the upper mantle and suggest that the Ronda peridotites underwent two main melting events at ~ 1.6-1.8 Ga and 1.2-1.4 Ga, respectively. One of these Proterozoic episodes probably coincided with the incorporation of the massif into the refractory subcontinental lithosphere. Other grains, generally those with low Os contents and high Re/Os, suggest that a third generation of sulfides precipitated in the Ronda peridotites at ~ 0.7-0.8 Ga. These sulfides may have formed by interaction of ancient grains with younger metasomatic melts/fluids, or by crystallisation of sulfide melts and sulfide-rich fluids, and suggest the percolation of metasomatic melts/fluids in the Neoproterozoic when the massif was equilibrated at subsolidus conditions. Considering the uncertainties inherent in model age calculations, the three “events” recognised in the Ronda sulfides correspond to the range of Nd model ages recorded in the crustal basement of Hercynian Europe and northern Africa (Fig. 3). The Proterozoic Os model ages exhibited by sulfides in the Ronda peridotites thus appear to reflect different stages in the evolution of the crustal mass of Gondwana, which was later recycled in the Paleozoic.

Contact: Claudio Marchesi
Funding: University of Grenada and ARC
Figure 3. Cumulative probability plots of Os model ages (TRD) for sulfides from the whole Ronda massif (black solid line) and Nd model ages (TDM) for crustal rocks from central/western Europe and northern Africa (yellow solid line).
Melt migration transforms New Zealand’s depths
High-p terranes commonly contain a mixture of high- and low-P assemblages. The high-P assemblages are variably interpreted as part of high-P crust (i) tectonically juxtaposed against low-P rocks that never experienced high-P; or (ii) associated with low-P assemblages in adjacent crust that (a) persisted metastably during the high-P event or (b) re-equilibrated extensively during exhumation. The distinction between these models is important, because a failure to distinguish widespread metastability or extensive retrogression may lead to invalid interpretations of the tectonic and metamorphic evolution of a terrane. Furthermore, misinterpretations of the metamorphic behaviour of large volumes of crust may lead to problems and inaccuracies in geodynamic modelling of large-scale tectonic events.
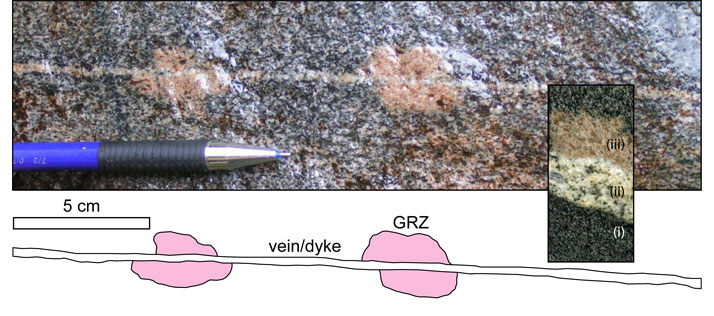
Figure 1. Outcrop photograph and sketch of a thin dyke and localised development of garnet reaction zone (GRZ) textures in irregular-shaped patches that are discontinuous and in some places are asymmetric with respect to the dyke (see flat bed scan of sample LG4051 that also shows the three key lithologies: (i) host Western Fiordland Orthogneiss (WFO), (ii) granodioritic dyke, and (iii) GRZ.
Recrystallisation of two-pyroxene hornblende granulite to garnet granulite is limited to a very small percentage (<10 %) of the crust in western Fiordland, New Zealand, suggesting that the assemblages in large parts of the deep crust persisted metastably under high-P conditions. Recrystallisation at high P is mostly associated with injection migmatite structures, in which narrow anorthositic or trondhjemitic veins and dykes cut two-pyroxene hornblende granulite facies orthogneiss. The host orthogneiss exhibits irregular, spatially restricted recrystallisation to garnet granulite along the edges of veins and dykes.
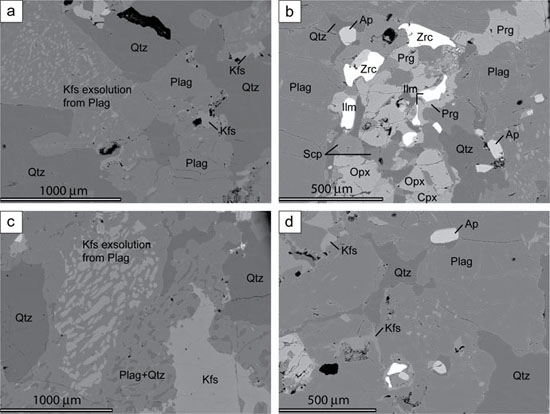
Figure 2. Back-scattered electron (BSE) images showing primary igneous and secondary textures in the dykes.
Recent research results:
A major arc batholith, the Western Fiordland Orthogneiss in Fiordland,New Zealand, exhibits irregular, spatially restricted cm-scale recrystallisation from two-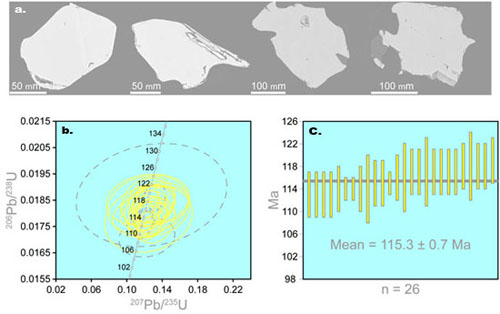 pyroxene hornblende granulite to garnet granulite flanking felsic dykes (Fig. 1; see GEMOC Publication 556). At Lake Grave in northern Fiordland, the composition and texture of narrow (<10-20 mm across) felsic dykes that cut the orthogneiss are consistent with an igneous origin (Fig. 2) and injection of melt to form orthogneiss migmatite. New U-Pb geochronology suggests the injection of dykes and migmatisation occurred at ca 115 Ma (Fig. 3), during the latter stages of arc magmatism. Recrystallisation to garnet granulite is promoted by volatile extraction from the host two-pyroxene
Figure 3. (a) BSE images of zircon from the narrow (< 20 mm) granodioritic dyke cutting sample LG4051 (Fig. 1). (b) U-Pb Concordia plot of a single zircon age population (n = 31). Dashed line error ellipses are excluded from the weighted mean age. (c) Weighted average mean diagram for the zircon data in (b); weighted mean by data-point errors = 115.3 ± 0.7 Ma (2σ), MSWD = 0.97 (n = 26/31) and probability = 0.5.
hornblende granulite via adjacent dykes and the patchily developed garnet granulite is left as a marker adjacent to the melt migration path. New modelling of mineral equilibria shows that a two-pyroxene hornblende assemblage is stable at P < 11 kbar, whereas a garnet granulite assemblage is stable at P > 12 kbar(Fig. 4), suggesting that garnet granulite may have formed with less than 5 km crustal loading of the batholith. Though the garnet granulite assemblages signify that the Western Fiordland Orthogneiss experienced high-P 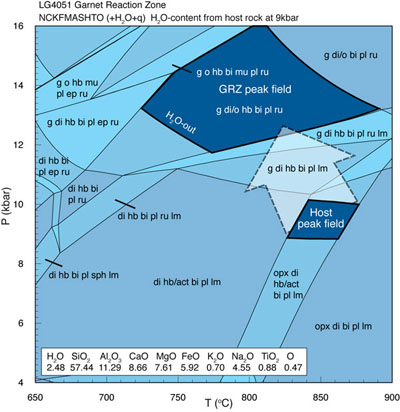 conditions, the very local nature of these textures indicates widespread metastability (>90 %) of the two-pyroxene hornblende granulite assemblages. These results indicate that metastable assemblages may be widespread in mafic lower arc crust during deep burial and demonstrate that the degree of reaction in the case of Fiordland is related to interaction with migrating melts.
Contact: Nathan Daczko
Funding: MQ Safety Net Grant
Figure 4. An H2O-saturated combined P-T pseudosection calculated for the LG4051 host (S1) and GRZ bulk compositions. The inferred peak S1 assemblage field is outlined in bold. The inferred peak GRZ quadrivariant assemblage field g-di-hb-bi-pl-ru-q-H2O, calculated with a fixed H2O-content equivalent to the minimum amount of H2O required to calculated the peak S1 assemblage at 9 kbar, is also outlined in bold. The arrow indicates a likely P-T path for the Lake Grave rocks.
Alloys in ophiolites wheel in new ideas on Earth evolution
Ophiolites are pieces of oceanic lithosphere that have been thrust onto the edges of continental plates; a complete ophiolite section consists of mantle-derived peridotites, overlain successively by mafic and ultramafic lavas and sedimentary rocks such as greywackes and cherts. The peridotitic members of the ophiolite sequences commonly contain bodies of massive chromite, in lenses, layers and veins, and the origins of these chromitites has been controversial for at least a century. The chromitites commonly contain scattered grains of Platinum-Group-Element (PGE) alloys, and these tiny grains are keys to the origins of the ophiolites. Rendeng Shi, one of GEMOC’s co-workers, has used a specially built separation plant to process tons of chromites from the Triassic-Jurassic Luobusa and Dongqiao ophiolites in Tibet, releasing several hundred grains of alloy minerals, and has used GEMOC’s facilities to analyse their elemental composition and their Os-isotope ratios. This has resulted in new insights into chromitite formation, the development of ocean basins, and the isotopic composition of the Earth’s convecting mantle (GEMOC publication #482).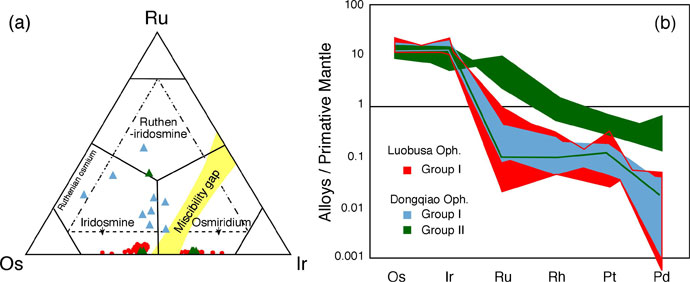
Figure 1. (a) Compositions of the analysed alloy grains from the Luobusa and the Dongqiao ophiolites in Os–Ir–Ru space.Note the two groups for Dongqiao Os-rich alloys, Group I with low Ru, and Group II with high Ru grains. (b) Primitive-mantle-normalised PGE concentrations of Group I and Group II alloys from Luobusa and Dongqiao (modified from GEMOC publication #482).
170 grains of Ru-Os-Ir alloys were analysed; most are osmiridium or iridosmine (Fig. 1). Based on elemental and isotopic compositions, two populations can be identified. Group I, found in both ophiolite bodies, has fractionated PGE patterns typical of similar alloys from other ophiolites. In contrast, Group II alloys from the Dongqiao ophiolites show PGE patterns with a “stepped” pattern, similar to those commonly seen in sulfide minerals that are residual after melting events (see GEMOC Publication #290). Group I alloys from both ophiolites have very homogeneous 187Os/188Os = 0.12645 ± 4 (2s; n=145), broadly consistent with the young age of the ophiolite. The Group II alloys from Dongqiao have more heterogeneous 187Os/188Os (0.12003 to 0.12194); referred to a typical Primitive Mantle evolution curve, these values yield Re-depletion ages from ca 950 to ≥1.1 Ga.
The Group I alloys are interpreted as early cumulate phases, precipitated during the crystallisation of magmas derived from the asthenosphere. In contrast, Group II alloys are inferred to reflect the breakdown of residual sulfides from the mantle section of the ophiolite, retained since a Proterozoic melt-depletion event. The signatures of such events would probably be lost by homogenisation in the convecting asthenospheric mantle, so these ancient depletion ages suggest that the Dongqiao mantle section originated as a piece of subcontinental lithospheric mantle, trapped during the opening of the Neo-Tethyan ocean (see Research Highlight, p30). The coexistence of the two groups of alloys in Dongqiao samples suggests interaction between asthenosphere-derived melts and old depleted lithospheric mantle and implies that the chromitites originated through such melt-rock reactions.
The data on the Group I alloys also have implications for the Os-isotope composition of the asthenospheric mantle, the framework in which most mantle Re-depletion ages (sulfides, alloys and whole-rock samples) are usually interpreted. The two ophioites have some relatively tight age constraints; both bodies are part of the Neo-Tethyan (Triassic-Jurassic) ocean system. Dikes cutting the Luobusa chromitites have been dated to 177±31 Ma, and cumulates from the Dongqiao body have given a Re-Os whole-rock isochron of ca 240 Ma, so that the Os-isotope composition of the Group I alloys should represent the composition of the convective oceanic mantle between ca 100-250 Ma. When compared with different models for the Os-isotope composition of the mantle (Fig. 2) this value plots well below the commonly used Primitive Mantle model, and above the Carbonaceous Chondrite model. Instead, these data support the hypothesis that the Re-Os evolution of the convective oceanic mantle resembles that of Enstatite Chondrites.
With this encouraging start, GEMOC is now carrying out analyses of Os-Ir alloys from ophiolitic sequences worldwide, to cover a larger age range.
Contacts: Rendeng Shi, Bill Griffin, Sue O’Reilly
Funded by: China NSF, ARC Discovery
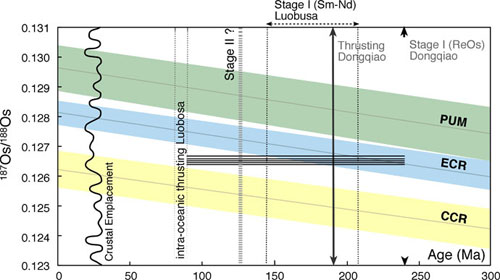
Figure 2. Models for the Re–Os evolution of the convecting mantle. Mantle evolution curves were defined as follows: CCR (Carbonaceous Chondrite reservoir) curve assumes that the Earth’s mantle has an Os isotopic composition and Re/Os similar to that of carbonaceous chondrites (187Os/188Os CC=0.1262 ± 0.0006, 187Re/188Os CC=0.392 ± 0.015 (Walker et al., 2002b)); ECR (Enstatite Chondritic Reservoir) curve is calculated using a present-day 187Os/188Os value of 0.1281 ± 0.0004 and
187Re/188Os=0.421 ± 0.013 as measured in enstatite chondrites (Walker et al., 2002b); PUM (Primitive Upper Mantle) curve has a present day 187Os/188Os=0.1296 ± 0.0008 and 187Re/188Os=0.42. These estimates were obtained by linear regression through suites of mantle-derived peridotite xenoliths and orogenic-massif peridotites sampling mainly the Proterozoic to Phanerozoic sub-continental upper mantle( Meisel et al., 2001) (modified from GEMOC publication #482).
Where are the diamonds in the Congo?
Our knowledge of the nature and composition of the subcontinental lithospheric mantle (SCLM) is largely based on the study of xenoliths and xenocrysts brought to the Earth’s surface by volcanism (e.g. kimberlite). Ni and Cr in pyrope garnets can be used to estimate temperature (TNi) and pressure (PCr) of equilibration. The pressure-temperature (P-T) relationships may be used to construct the geotherm. The depth of the lithosphere-asthenosphere boundary (LAB) can be estimated by Y and temperature relationship in garnet, the asthenosphere being characterised by absence of lo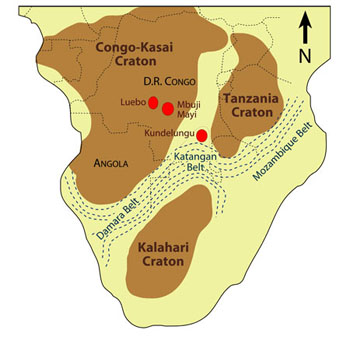 w-Y garnets (< 10 ppm). Zr, Y, Ga and Ti contents in garnets can be used in order to determine the types of metasomatism in the SCLM where the garnets were derived. The increase in Zr accompanied by increases in Y and Ti indicate melt metasomatism whereas an increase in Zr with low to moderate Ti, Y and Ga characterise phlogopite metasomatism (Griffin et al., 1992, CMP 110 and GEMOC publication #1). Garnets can be categorised into 5 groups based on their inter-element correlations: depleted harzburgites, depleted lherzolites, depleted/metasomatised lherzolites, fertile lherzolites and melt-metasomatised peridotites (GEMOC publication #299).
Figure 1. Sketch geological and locality map for sub-Saharan Africa showing the main cratonic areas (brown).
Given the depth at which the garnets equilibrated and the geochemical process and rock type indicated by the composition of the garnets, the proportion of the garnets reflecting individual rock types and processes at particular depths can be calculated. This allows the construction of a section through the lithosphere showing the variation in the proportions of rock types or types of processes with depth. These sections have been described as “Chemical Tomography” (see GEMOC publication #409 for more information).
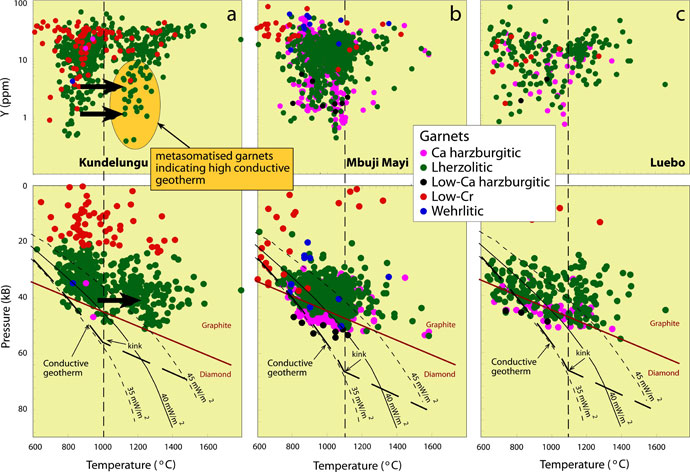
Figure 2. Conductive geotherms for Kundelungu (a), Mbuji Mayi (b) and Luebo (c). Note the geotherm is
35 mW/m2 for all the region and the presence of low-Y garnets with high temperature in Kundelungu but not observed in Mbuji Mayi and Luebo.
Garnets included in diamond are characterised by high XMg [Mg/(Mg+Fe)], and show sinuous rare-earth element (REE) patterns with enrichment in MREE and depletion in HREE. Malkovets et al. (2007, GEMOC publication #449) suggested that the presence of abundant chromite associated with garnets showing these characteristics indicate the presence of diamond.
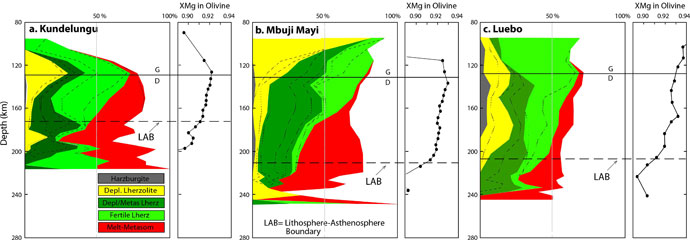
Figure 3. Subcontinental lithospheric mantle chemical tomography for Kundelungu (a), Mbuji Mayi (b) and Luebo (c). The horizontal line marked G-D gives the depth for the graphite-diamond stability field in the region. The LAB depth is drawn based on the decrease in XMg in olivine coexisting with garnet.
This study applies this methodology to data from xenocrystic peridotitic pyrope garnets from Kundelungu, Mbuji Mayi and Luebo in the southern part of the Democratic Republic of the Congo (Fig. 1; GEMOC publication #565). Because the Mbuji Mayi and Luebo regions are located inside the Congo-Kasai Craton whereas Kundelungu is outside of the craton, this study provides an opportunity to compare the composition and structure of the lithospheric mantle and kimberlite peridotitic diamond potential in two different geological settings. The data allow the following conclusions:
1. Despite the location in two different tectonic settings, Kundelungu, Mbuji Mayi and Luebo are characterised by low, cratonic-type conductive geotherms (Fig. 2), but the deeper parts of the Kundelungu section have been thermally disturbed.
2. The lithospheric mantle beneath the Kundelungu area (off-craton) is relatively thin and fertile compared with that represented by garnets from Mbuji Mayi and Luebo (on-craton) (Fig. 3), and may represent refertilised Archean cratonic lithosphere as also shown by zircon data (GEMOC publication #464).
3. The disturbance of the initially low geotherm in Kundelungu is correlated with the upwelling of melts related to the opening of the East African Rift.
4. The mantle sections beneath the Kundelungu, Mbuji Mayi and Luebo regions were affected by melt-related and phlogopite-related metasomatism but these effects, and especially the melt-related metasomatism, were most pronounced in Kundelungu.
5. The Mbuji Mayi and Luebo areas have higher peridotitic diamond potential as shown by abundant harzburgitic garnets with characteristics similar to those of garnets included in diamond and abundance of chromite (Fig. 4 for Luebo
6. The apparent scarcity of diamonds in the kimberlites of the Kundelungu Plateau as indicated by the scarcity of harzburgitic garnets and chromite is attributed to the heating and melt-related metasomatism that has affected the lithosphere in the region. Some of Kundelungu lherzolitic garnets have characteristics similar to garnets included in diamond (Fig. 4).
Contacts: Jacques Batumike, Bill Griffin, Sue O’Reilly
Funding: ARC Discovery and Linkage grants (SYO’R and WLG), iMURS, IPRS, PGRF and Macquarie International travel grant (JMB)
O
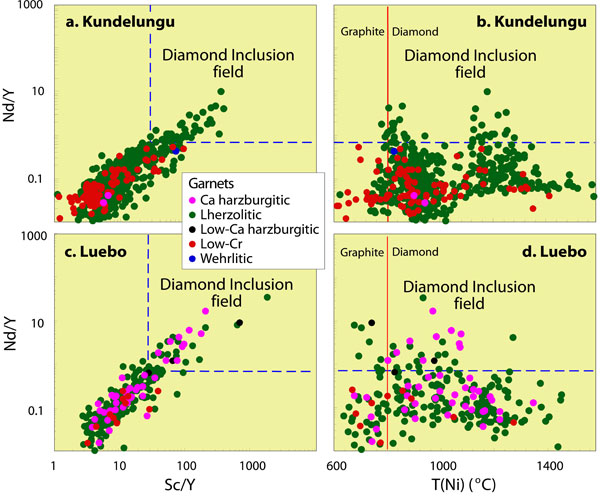
Figure 4. Nd/Y-Sc/Y and Nd/Y-T(Ni) plots for Kundelungu (a,b) and Luebo (c,d) garnets. Note the presence of lherzolitic and harzburgitic garnets similar to diamond-inclusion garnets, plotting within the diamond-stability field.

 GEMOC ARC National Key Centre