 GEMOC ARC National Key Centre
Analytical Methods used in GEMOC
This web page is designed to document some of the analytical methods currently in use in the GEMOC Geochemical Analysis Unit, and to provide updates on technological developments (see also the Technology Development section of the GEMOC Annual Report). References are given to published examples where relevant.
Contents:
1. Sulfur analysis in rock samples
2. Trace element analysis of rock samples (ICPMS)
3. In-situ elemental analysis (LAM-ICPMS)
3.2 PGE analysis of sulfide minerals
4. Whole-rock isotopic analysis
4.1.2 Mass spectrometry (MC-ICPMS)
4.2.2 Mass spectrometry (MC-ICPMS)
1. Sulfur analysis by high-temperature iodo-titration (HTIT)
This description is taken from the PhD thesis of Olivier Alard (2000).
S is a key element in dealing with siderophile and chalcophile elements in the mantle. However, S is not an easy element to analyse, especially in the range below 50 ppm which is the overall detection limit of XRF, ICP-AES and ICPMS. Unfortunately, many mantle samples have S contents below 50 ppm (e.g. Lorand, 1991, Ionov et al., 1992). I therefore used an induction-furnace iodometry method. This method has been used successfully by Dr. J.P. Lorand and M. M. Gros for the last 10 years at the Museum National d'Histoire Naturelle de Paris, France. This method has been directly imported from the MNHN and reproduced at Macquarie University for the needs of this project. Any reference to the work presented here should include proper acknowledgments to M. M. Gros and Dr. J.P. Lorand.
This method is specifically designed for rocks with low S contents, typically between 5 and 500 ppm. More S-rich samples could be analysed but the analytical uncertainty would increase quite rapidly, and the XRF method, which has a detection limit around 50 to 100 ppm, would be more suitable for such high-S samples. The iodometry method is most useful for samples having S contents lower than 100 ppm (e.g. ultrabasic rocks), but is not suitable for rocks having a significant contents of organic matter, for reasons of chemistry and safety.
The accuracy of this method is about 2 ppm. However, in the special case of S analysis in S-depleted rocks, reproducibility is more dependent on the heterogeneous distribution of sulfur than on the analytical technique (see below).
Outline of the method
The method is based on the oxidation of sulfur in the sample to SO2 and measurement of the quantity of sulfur released by an iodo-titration reaction. Sulfur vaporisation is achieved by first carefully and thoroughly mixing a given amount of sample powder (usually between 0.5 to 2 g) with the same amount of V2O5, which acts as a strong oxidant. The mixed powder is then placed in a ceramic or quartz-glass combustion boat (Figure 2.2) and placed in a quartz glass tube, which fits into a tube furnace set to 955±5 °C. The quartz tube is sealed and a constant flow of N2 gas is introduced. The N2 is only used as a carrier and does not act as a chemical reagent. At 955±5°C and atmospheric pressure S is volatile. Then under the action of V2O5, the S2- gas released will be oxidised to SO2 or SO3 (eq. 2.1).
 eq 2.1
A Cu buffer fills the end of the quartz tube, and this reduces any SO3 to SO2
 eq 2.2
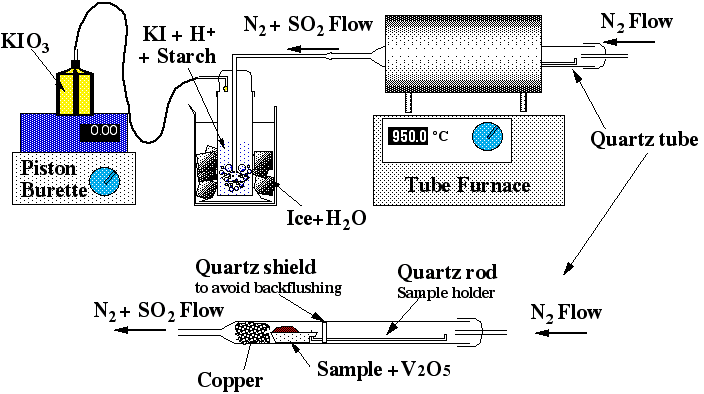
Figure 2.2: Sketch of the sulfur apparatus
A wash bottle linked to this quartz tube allows the SO2 carried by the N2 to bubble through a solution of diluted hydrochloric acid and potassium-iodate. At the other end of the wash bottle a piston burette (Titronics 96, SCHOTT) delivers KIO3 drop by drop. The use of the piston burette allows an accuracy of 0.01 ml and makes the analysis less user-dependant than a "classical" micro-burette. Starch is added to the wash bottle as a coloured indicator of oxido-reduction. The addition of 1 to 2 drops of KIO3 colours the solution in the wash bottle a pale purple-blue; the reaction is rapid. Therefore as soon as the combustion boat is placed into the tube and the quartz tube is sealed (within 30s), the SO2 will be released and the solution discoloured (eq 3a and 3b).
 eq 2.3a
 eq 2.3b
As soon as the blue colour disappears, more KIO3 is added until no further discolouration occurs. Then the analysis is completed; this usually takes no longer than 30 minutes.
Note: NaN3 (a powerful reducing agent) can be added to the HCl + KI + starch solution in order to prevent any "small" explosion related to organic matter in the samples.
Following equations 3a and 3b, the quantity of S in the samples can be calculated as follows:
- 1 mole of KIO3 (M(KIO3)=214g) reacts with 3 moles of S (M(S)=32.06), which means that 214g of KIO3 reacts with 96.18 g of sulfur. 6 electrons are exchanged during this oxidation-reduction reaction as iodine goes from the +4 state in IO3- to the -1 state in I- when the reaction is completed.
- Given θ the normality of the KIO3 solution, then:
1 mil of KIO3 is equal to  µg of S in x grams of sample (eq 2.4)
Assessment of the accuracy of the iodo-titration method
The suitability of this method and its accuracy have been assessed by Lorand and Gros (unpublished report) by comparing S analyses obtained by iodotitration and by XRF (Figure 2.3).
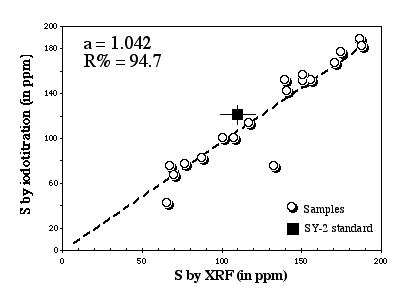
Figure 2.3: Comparison between XRF and the Iodotitration method. Data from Lorand and Gros (unpublished data).
The accuracy of the method is heavily dependent on the accuracy with which the KIO3 solution is delivered. The accuracy of the method itself is better than ±0.5 ppm, but a more realistic estimate is about 1 to 2 ppm. The detection limit of this method can not be calculated in the usual way (3σof the blank), because the blank is usually less than the smallest quantity analysable (4 to 5 ppm). However the blank is checked at the beginning of each analytical session by running 1 or 2 g of vanadium penta-oxide (the fusing oxidising reagents). Seven analysis as such demonstrate a blank level below 6 ppm.
Replicate analyses of the USGS standard SY-2 (Syenite) gave an average of 121 ± 4 ppm (2σ error) over a 4-year period, compared to a recommended value equal to 110±9 ppm (Figure 2.4).
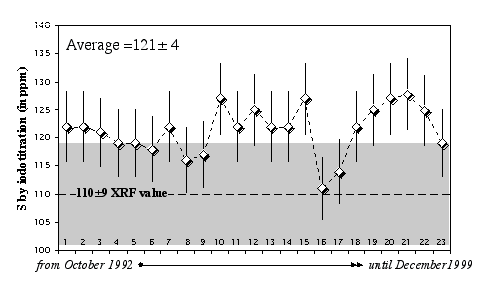
Figure 2.4: Replicate analyses of the rock standard SY-2 (Syenite, CCRMP) using the HTIT facility at the Muséum National d'Histoire Naturelle de Paris (France). Data are from Lorand (1991), Pattou (1995), Luguet (2000), and this study. The XRF value of 110±9 ppm is provided by the CCRMP (Canmet).
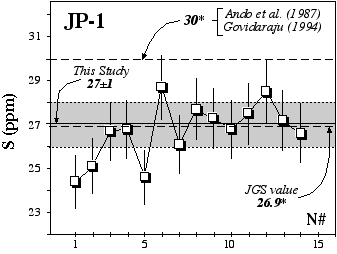
Figure 2.5: Replicate analyses of the rock standard JP-1 (Orogenic Peridotite, Horoman, Japan, JGS)using the GEMOC HTIT analytical facility. * denotes information value rather than certified value.
More recently, replicate analyses at Macquarie University of JP1 (peridotite, JGS) gave an average of 27±1 ppm over a 1 year period (Table 2.4, Figure 2.5). Proposed or information values (Govidaraju, 1994; Ando et al., 1989; Japanese Geological Survey Report) of 30 and 26.9 ppm agree well with our results. However Burnham (1995) obtained an extreme value of 0±8 ppm using a LECO analyser. This report argued that nugget effects on the oxidation of S may produce high variability between analyses. Despite some variations, which may be ascribed to the "nugget effect", we do not observe such discrepancies.
To further document the suitability of this method we have analysed various reference materials having certified or recommended values for S (Table 2.4, Figure 2.6). These reference materials have been chosen to cover the S range reported for mantle peridotites (<5 to 500 ppm).
Table 2.4. S values (± standard deviation) for several international rock standards using HTIT method.
| N# | Mean | Rock type | Ref. Value | V.T | Provider | |
| DTS-1 | 2 | 7±3 | Dunite | 124,5 | R | USGS |
| JP-1 | 14 | 27±1 | Peridotite | 26.92 (303) | R | JGS |
| RGM-1 | 2 | 10±3 | Rhyolite | 544 | I | USGS |
| W2 | 1 | 76±5 | Diabase | 794,5 | I | USGS |
| BHVO-1 | 5 | 93±7 | Basalt | 1024 | R | USGS |
| BHVO-2 | 1 | 132±13 | Basalt | n.a. | USGS | |
| SY-2 | 25 | 121±4 | Syenite | 110±9 1 | R | CCRMP |
| WGB-1 | 4 | 145+12 | Gabbro | 200±1001 | IR | CCRMP |
| GSP-1 | 1 | 344±17 | Granodiorite | 3204 | P | USGS |
| DNC-1 | 1 | 411±13 | Dolerite | 3924 | I | USGS |
N#: number of analyses performed. All but SY-2 were performed using the GEMOC HTIT facility. SY-2 analyses from the MNHN Lorand and Gros, unpublished data. 1, CCRMP (Canmet) values; 2, Japanese Geological Survey value; 3, Ando et al., 1987; 4, Govindaraju, 1994; 5, USGS value; n.a., not available. V.T, Value Type: R, recommended; P, Proposed; I, information; IR, information range.
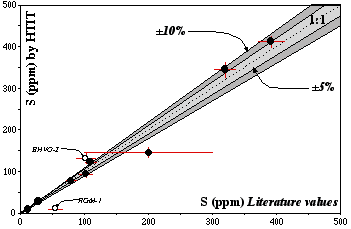
Figure 2.6: S contents obtained by the HTIT method during this study vs published values for international rock standards
Data are reported in Table 2.4. Dashed line (1:1 line) represents perfect agreement; light and dark grey fields are within 5% and 10%, respectively, of this line.
Figure 2.6 and Table 2.4 show that our values are in excellent agreement with previously published values obtained by alternative methods. Unfortunately, errors and methods used are difficult to obtain. Therefore our precision cannot be truly compared to other methods. The data for RGM-1 (Rhyolite, USGS) and BHVO-2 (basalt, USGS) show discrepancies of more than 10% from previously reported values. For RGM-1 our value is significantly lower (10±3, N#=2) than the literature value of about 54 ppm. However, this RGM-1 value is only a proposed value (Govindaraju, 1994), and its validity unfortunately cannot be assessed. The BHVO-2 (basalt, USGS) does not yet have a recommended S value; I therefore assumed that it is roughly similar to BHVO-1 (S=102, proposed value, Govindaraju, 1994, Information value, USGS). However, I measured a S content of ca. 132 ppm (±10%, N#=1) for BHVO-2.
The otherwise excellent agreement between HTIT values and published values as well as the long term accuracy demonstrated by replicate analyses of SY-2 and JP-1 indicate that this method produces reliable results.
References
Burnham, M.O., 1995. The geochemistry of Re and Os in ultramafic rocks from the Pyrenées and Massif Central, France. Ph.D. Thesis, Open university, 248 pp.
Govidaraju, K., 1994. 1994 compilation of working values and samples description for 383 geostandards. Geostandards Newsletter, 18((special issue)): 158 pp,.
Ionov, D.A., Hoefs, J., Wedepohl, K.H. and Wiechert, U., 1992a. Content and isotopic composition of sulphur in ultramafic xenoliths from central Asia. Earth and Planetary Science Letters, 111: 269-286
Lorand, J.-P., 1991. Sulphide Petrology and Sulphur Geochemistry of Orogenic Lherzolites: A Comparative Study of the Pyrenean Bodies (France) and the Lanzo Massif (Italy). J Pet, "Orogenic Lherzolites" Spec. Issue: 56-77.
Luguet, A., 2000. Pétrologie des sulfures de Fe-Ni-Cu et Géochimie des éléments fortement siédrophiles: etude couplée dans les péridotites abyssales de la zone de fracture Kane (zone MARK, 20-24, Ride médio-atlantique et du site EDUL (49-70°E, ride sud-ouest indienne). Ph.D Thesis, Museum National d'Histoire naturelle de Paris, Paris, France, 355 pp.
2. ICPMS Analysis of rock samples
The description given here is taken from the PhD thesis of Olivier Alard (2000). It is particularly concerned with dissolution methods and their effects on accuracy and precision, and with inter-laboratory comparisons.
Solution ICPMS work carried out in the GEMOC Geochemical Analysis Unit at Macquarie University during this work used two ICPMS instruments: a Perkin Elmer Sciex Elan 6000 and an Agilent HP4500 featuring a shield torch. An Agilent 7500 ICPMS is currently in operation and details of its performance will be posted here later.
Method
REE, HFSE (Nb, Ta, Zr, Hf), LILE ( Cs, Rb , Ba, Th, U, Sr) as well as minor and transition elements (Ni, Cr, Mo, Zn, Cu, V, Ti, Ga) were analysed. Several rock digestion procedures have been used, all performed in teflon beakers using 100 mg of sample. For each batch, USGS and JGS rock standards have been included in order to check the accuracy of the analyses (Table 2.2).
Attack A : HNO3/HF (1:1) at 120ºC for 24 hours in a closed beaker, followed by an evaporation and then a second HNO3/HF (1:1) digestion. The mixture is evaporated to incipient dryness and 10 ml of 6N HNO3 is added. The beaker is tightly capped and heated overnight; again the sample is taken to dryness and then 10 ml of 2% HNO3 is added. The beaker is capped, heated and held in an ultrasonic bath until the residue is fully dissolved. The solution is then transferred to a bottle and the volume is make up to the final weight; e.g to 100 g for a dilution factor of ca. 1000.
Attack B: This is a perchloric/hydrofluoric attack method developed in Montpellier II University, France (Geofluid laboratory, see . The sample is attacked with HF/HCLO4 (2.5:1) at 160ºC for 48 hours in a closed beaker. This first step is followed by evaporation to dryness and a second HF/HCLO4 (2:1) attack is done overnight. Then three evaporations are performed with deceasing quantities of HCLO4 (1, 0.5, 0,25 ml) and increasing temperature up to 180-190ºC, in order to expel all fluoride salts. Once the sample is dry, it is dissolved in 2% HNO3 and diluted for ICPMS analysis.
The solutions have been analysed either at GEMOC using Perkin Elmer Sciex Elan 6000 and an Agilent HP4500 or at Montpellier II University using a VG 353 Plasma Quad ICPMS. Drift is corrected using doping elements: In and Bi in Montpellier, 6Li, Ru, In and Bi at GEMOC. External standard calibration is used in both laboratories.
Reproducibility, accuracy.
Standards
The accuracy of each analytical technique has been checked by carrying out replicate analyses of standard materials having certified values. Good agreement between our values and recommended or previously published working values is observed for most of the elements and for most of the reference materials analysed during this study when analyses obtained after HNO3/HF digestion are compared. This conclusion is true for both mafic and ultramafic standard materials. Similar good agreement is obtained with HClO4 attacks for mafic standards. However, we obtained systematically higher contents for rare earth elements in ultramafic standards when using HClO4 acid digestions. As discussed above, this is ascribed to the higher recovery achieved with HClO4 procedures. Good agreement between Montpellier and GEMOC data is observed for ultramafic standards analysed after HClO4-based digestion. This agreement allows a straightforward and confident comparison of the data obtained during this study in the two different laboratories.
Our analyses of JP-1 in both laboratories show systematic discrepancies with the JGS working values. However because of: (1), the overall good agreement between our values and previously published values for other reference materials having similar matrices; (2), the good agreement between our values and other recently published values (Ionov et al., 1992; Yokoyama et al., 1999), we may suggest that the JGS values need to be reassessed.
Reproducibility issues
Recent work has suggested that HNO3-HF attack and evaporation gives lower recovery, especially for REE, than can be obtained using a HF-HClO4 digestion technique (Yokoyama et al., 1999). The formation of fluoride complexes may scavenge and precipitate out of solution some of the REEs. The addition of HClO4 to the digestion mixture and/or during subsequent evaporations has been long recognised as an efficient way to get rid of these fluoride complexes (Ionov et al., 1992; Blichert-Toft et al., 1997; Yokoyama et al., 1999). The amount of REE deficit for HF/HNO3 attacks has been estimated in the GEMOC laboratory by repetitively analysing international reference materials using the HNO3 and HClO4 digestion procedures (Sharma et al., 2000). Such estimates are essential in order to assess to which extent inter-laboratory and inter-technique data can be compared. The results of this study demonstrate that:
- For ultramafic matrices, REE recovery using HF/HClO4 digestion and evaporation are higher than for HF/HNO3 procedure. This is especially significant for the MREE; recovery is 20-40% higher for MREE, while LREE and MREE show an increase of about 5-20% (Figure 2.1). Higher recoveries are also observed for LILEs (Å5-25%). Much higher U recovery is also observed (up to 50%).
- For mafic matrices (ie. basalts: BCR-1, BHVO-1) recovery percentages obtained with the two methods are within error of each other (<5%).
This indicates that there is a matrix effect on either fluoride formation or fluoride breakdown (Yokoyama et al., 1999). However, HClO4 digestions yield higher blank levels, because of the difficulty of efficiently purifying HClO4, and the longer evaporation time required by the HClO4
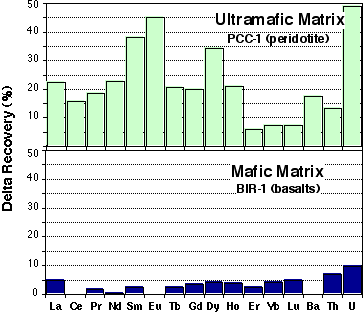
Figure 2.1:Comparison of recovery percentage between HClO4 and HNO3 digestion procedures.
Two representative experiments are presented here for mafic and ultramafic matrices.
 ,
,
Where:  and
and  is the average concentration of an element i obtained from 4 analyses of 2 different powder aliquots of the same material performed with HClO4 and HNO3 digestion, respectively.
  is the published value for this element in the same reference material. Data from Sharma et al. (2000).
These results suggest that care must be exercised in comparing whole-rock REE data obtained with various chemical procedures. Only large variations should be considered as "real". If sample and standard do not have similar matrix chemistry, and agreement between the analyses and recommended values for standard materials does not ensure the accuracy of the sample analyses.
Detection Limits
Detection limits are calculated as and are reported in Table 2.3. The detection limit reflects the level and especially the variability of the chemistry blank for each element. This blank is the sum of acid blank, teflon ware blank and contamination during the evaporation and manipulation stage. Detection limits for most of the heavy and medium REE in both the Montpellier and the Macquarie laboratories are below 1 ppb. Light REE show slightly higher detection limits, up to Å 10 ppb for La, reflecting a more variable blank level for those elements. However, elements such as Ba, Sr and Pb show much higher detection limits due to a high blank level. Those elements are unfortunately notorious for being common contaminants in all laboratories as they are very abundant elements.
Table 2.3. Detection limits (in ppb) for solution ICPMS runs
| Element | Ni | Cr | Cu | Rb | Sr | Y | Zr | Nb | Cs | Ba | La | Ce | Pr | Nd | Sm |
| GAU* | 168 | 385 | 160 | 10 | 82 | 1 | 16 | 12 | 74 | 2 | 4 | 1 | 2 | 2 | |
| UM II? | 25 | 50 | 25 | 5 | 290 | 8 | 6 | 1 | 5 | 1.6 | |||||
| Element | Eu | Gd | Tb | Ho | Er | Tm | Yb | Lu | Hf | Ta | Th | U | Pb | ||
| GAU* | 0.7 | 0.5 | 0.2 | 0.5 | 0.8 | 0.8 | 0.2 | 1 | 1 | 0.2 | 0.3 | 46 | |||
| UM II? | 0.5 | 0.6 | 0.1 | 0.5 | 0.2 | 0.6 | 0.2 | 0.2 | 1 | 0.6 | 1 | 0.6 | (60) | ||
?: detection limits obtained at Geofluides laboratory are calculated chemistry (method) blanks for a 5 year period (1996-2000). All Geofluides laboratory dissolutions involve large quantities of HClO4.*Geochemical Analyses Unit at GEMOC, Macquarie University
Table 2.2: International rock standard trace element values and reference data for solution ICP-MS work.
| PCC-1 | JP-1 | UBN | BIR-1 | |||||||||
| GAU? | GAU* | UM II? | R1* | GAU* | GAU? | R2? | JGS? | UM II | R3 |
|
R1 | |
| in ppb | n=33 | |||||||||||
| Cu | ?11.2±0.2 | ?5.7±0.2 | n.d. | ?7 | ?3.7±0.6 | ?3.2±0.4 | n.d. | ?6.7 | 117±3 | 126 | ||
| Zn | ?29.8±0.4 | n.d. | n.d. | 31 | ?48±5 | ?30.3± | n.d. | ?41.8 | 68±2 | 71 | ||
| Rb | 59±18 | 61±9 | 101±10 | 58 | 32±2 | 33±4 | 34 | 80 | 3.50±0.19 | 3.27 | 0.23±0.02 | 0.24 |
| Sr | 324±11 | 446±43 | 359±49 | 330 | 612±86 | 550±42 | 570 | 600 | 7.7±0.7 | 7.09 | 110±2 | 110 |
| Y | 65±8 | 80±6 | 87 | 92±8 | 105±6 | <0.1 | 16.6±0.3 | 16.5 | ||||
| Zr | 166±12 | 133±18 | 115±15 | 191 | ?5.1±0.4 | 5.1±0.4 | ?5.0 | ?5.92 | 3.30±0.13 | 15.3±0.2 | 14.5 | |
| Nb | 13 ±3 | 18±3 | 25±5 | 11 | 48±4 | 38±6 | 67 | 1540??? | 0.071±0.014 | <0.1 | 0.57±0.01 | 0.55 |
| Ba | 940±25 | 810±11 | 940±82 | 760 | ?9.6±0.2 | ?10.3±0.2 | ?19.5 | 27.0+1.5 | 27.4 | 6.75±0.08 | 6.40 | |
| La | 41±8 | 35±6 | 61±12 | 29 | 34±5 | 39±5 | 38 | 84 | 0.35±0.02 | 0.5 | 0.69±0.06 | 0.58 |
| Ce | 63±8 | 55±6 | 99±18 | 53 | 64±6 | 75±7 | 67 | 154 | 0.83±0.04 | 0.85 | 1.88±0.02 | 1.85 |
| Pr | 8.8±2.1 | 7.6±3.1 | 12±3 | 6.8 | 8.3±1.8 | 9.9±1.2 | 12 | 20 | 0.127±0.008 | 0.13 | 0.376±0.003 | 0.37 |
| Nd | 37±4 | 31±12 | 42±6 | 25 | 37±4 | 43±2 | 39 | 72 | 0.64±.04 | 0.60 | 2.37±0.03 | 2.35 |
| Sm | 11.4±0.6 | 6.1±0.7 | 7.7±1.6 | 5 | 9.4±0.6 | 15.6±0.9 | 19 | 19 | 0.222±.013 | 0.21 | 1.10±0.01 | 1.10 |
| Eu | 1.6±0.3 | 1.1±0.3 | 1.6±0.5 | 1.1 | 2.4±0.3 | 3.1±0.3 | 4.0 | 3.6 | 0.082±0.006 | 0.08 | 0.52±0.01 | 0.52 |
| Gd | 6.6±0.6 | 5.4±0.5 | 7.3±1.4 | 6.1 | 10.9±0.6 | 11.8±0.5 | 15 | 16 | 0.325±0.017 | 0.31 | 0.351±0.005 | 0.38 |
| Tb | 1.4±0.2 | 1.1±0.3 | 1.3±0.3 | 1.2 | 1.9±0.2 | 2.1±0.2 | 2.6 | 3 | 0.061±.004 | 0.06 | 1.78±0.02 | 1.97 |
| Dy | 12.1±0.8 | 9.1±0.5 | 11.1±1.2 | 8.7 | 13.4±0.7 | 16.8±0.6 | 20 | 22 | 0.44±0.02 | 0.41 | 2.52±0.03 | 2.50 |
| Ho | 3.3±0.4 | 2.7±0.3 | 3.1±0.4 | 2.7 | 3.4±0.3 | 3.9±0.2 | 5.2 | 18 | 0.097±0.005 | 0.10 | 0.586±0.007 | 0.57 |
| Er | 12.0±0.8 | 11.3±0.3 | 12.6±1.7 | 11.3 | 12.4±0.3 | 12.8±0.3 | 16 | 16. | 0.292±0.015 | 0.28 | 1.73±0.03 | 1.70 |
| Tm | 26.9±0.3 | 0.045±0.002 | 0.05 | 1.61±0.02 | 1.60 | |||||||
| Yb | 23.0±0.7 | 21.6±0.5 | 23.4±1.2 | 21.3 | 19.5±0.4 | 20.6±0.6 | 23.2 | 22 | 0.293±0.015 | 0.31 | 0.252±0.008 | 0.25 |
| Lu | 5.0±0.3 | 4.7±0.2 | 5.5±0.5 | 4.6 | 4.1±0.1 | 4.2±0.2 | 5.0 | 4.4 | 0.050±0.003 | 0.05 | 0.577±0.007 | 0.56 |
| Hf | 5.4±2.2 | 3.7±1.2 | 5.1±1.1 | 5.4 | 120±3 | 126±2 | 126 | 200 | 0.129±0.07 | 0.15 | 0.042±0.002 | 0.06 |
| Ta | 1.3±0.4 | 1.4±0.3 | 1.9±0.4 | 2 | 4.1±0.3 | 4.5±0.6 | 4.8 | 20 | 0.016±0.003 | n.d. | 2.7±0.2 | 3.00 |
| Th | 12.4±0.4 | 11.9±0.4 | 10.2±0.7 | 11.5 | 14.5±0.6 | 15.7±0.8 | 19 | 190 | 0.071±0.013 | 0.06 | 0.039±0.005 | |
| U | 6.9±0.5 | 5.0±0.3 | 4.6±0.4 | 3.9 | 14.7±0.3 | 16.5±0.5 | 36 | 36 | 0.060±0.014 | 0.06 | 0.0111±0.0006 | 0.01 |
All reference data are ICPMS data. R1, Eggins et al., (1997) HF/HNO3 digestion procedure. R2, JGS working values; R3. Ionov et al. (1992) Montpellier University HF/HClO4 procedure; R4, Garbe-Shönberg (1993). *using a HF/HNO3 attack; ? using a HF/HClO4 attack; ?, analytical technique not reported; ?: denotes value in ppm; n.d., not determined.
References
Ionov, D.A., Savoyant, L. and Dupuy, C., 1992. Application of the ICP-MS technique to trace element analysis of peridotites and their minerals. Geostandards Newsletter, 16: 311-315.
3. In-situ trace element analysis (LAM-ICPMS)
The information presented here is extracted from the PhD thesis of Olivier Alard (2000).
GEMOC, in collaboration with New Wave Research and Agilent Technologies, is currently carrying out detailed tests of different laser systems and their performance with the Agilent 7500 ICPMS. Results will be posted here when the tests are completed.
Laser ablation microprobe ICPMS has several advantages:
- High spatial resolution
- Low detection limit
- Rapid analysis
- Wide range of elements (LILE, HFSE, REE, HSE)
- Variety of target materials (Silicates, Carbonates, Oxides, Metal, Sulfides)
Instruments
Basically, the instrument consists of two parts; a laser ablation system in which the sample is ablated and transferred, by a stream of high purity gas, to the second part of the instrument, the quadrupole ICPMS
Two Laser ablation microprobe systems were used during this study:
- an in-house laser ablation line (built by S. E. Jackson),
- a Merchantek LUV266 laser system.
Three quadrupole ICPMS instruments have been used during this study, the Perkin-Elmer Sciex ELAN 5100, the Perkin-Elmer Sciex ELAN 6000 and the Hewlett Packard 4500. Most of the work presented in this thesis has been done with the PE 6000. The various ICPMS instruments were tuned to produce 248ThO/232Th<1%. Typical operating conditions for each ICP-MS are reported in Table 2.12. Note that The HP4500 features a shield torch. This system greatly enhances the sensitivity of the instrument as can be seen in Table 2.13, where typical detection limits for each instrument are reported.
Table 2.12: Typical ICP-MS operating conditions for Laser ablation runs
| ICP-MS | PE 5100 | PE 6000 | HP 4500 |
| Forward (reflected) power (in W) | 1040 | 1050 | 1300 |
|
Gas Flow (in l/min) Carrier[auxiliary] |
Ar(1.01) | Ar (0.9)+He(0.8) [Ar(0.8)] | Ar()+He(0.93) [Ar(0.8)] |
| Detector mode | Dual (pulse) | Dual (pulse) | pulse and analog (for major elements only) |
| Sweep mode | Peak hopping | Peak hopping | Peak hopping |
| Dwell time (ms) | 50 | 50 | 30 |
The in-house laser ablation system developed by S.E. Jackson has been extensively described by Norman et al. (1996; 1998). The Merchantek laser system has characteristics quite similar to the "Jackson ablation line". Therefore instrumentation and operating conditions of the system will only be briefly outlined here after. Both are frequency quadrupled Nd:YAG lasers that provide a beam with a wavelength of 266 nm operating at a frequency between 10 to 4 Hz. Both of them use a large ablation cell designed by S.E. Jackson. The commercially supplied cell of the Merchantek laser was replaced by the GEMOC cell, because it provides a more stable signal and a better efficiency (for a given set of ablation characteristics we obtained a higher count rate with this cell than with the original one). Furthermore, as the first analyses were performed in this large cell, it was considered judicious in terms of reproducibility to use the same cell all through this study.
a The in-house laser system (the Jackson line)
is based on a continuum surelite I-20, Q-switched laser. The beam is directed through a petrographic microscope onto the sample (Figure 2.12) with a typical spot size ranging from 20 to 200 µm. Except in the early stages of the project (1998), most of the ablations (silicate and sulfide) have been performed in a He atmosphere. The analyte is carried from the sample chamber to the ICPMS by a flow of Ar +He (50/50%). However, wash-out is more efficient when Ar is flushed through the ablation cell. Hence after each ablation run, the gas line feeding the ablation cell is switched to Argon for Å60 seconds, then back again to He.
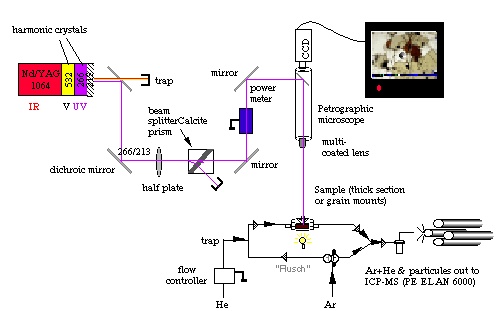
Figure 2.12. Sketch showing the in-house laser ablation system used during this study. During analysis He streams through the sample cell. He+analyte is mixed through a Y-connector with Ar and carried to the plasma torch. As soon as the analysis is completed the user switches the stopcock in order to allow a mix of Ar+He to flush through the sample cell. This latter feature is probably due to the very large ablation cell used for this study (a S.E. Jackson design). However, this drawback is compensated by the fact that several samples and standards can be fitted in this cell. This feature ensures that ablation conditions for samples and standard are strictly identical.
b The Merchantek LUV 266
The Merchantek laser system has characteristics similar to those of the "Jackson ablation line"; the same gas flow and cell volume are used.
3.1 Silicates and Oxides
This technique provides trace element analyses to sub-ppm levels with a precision of <5% and gives results which have been found to correlate well with those of the proton microprobe (Norman et al., 1996, 1998) or separated mineral fractions analysed by solution ICPMS (e.g. this study). Analyses are normalised to 44Ca or 25Mg contents previously determined by EMP. The external standards used for silicates were the NIST 610 and 612 glasses. This double normalisation to an internal and external standard allows efficient correction for variations in instrument and ablation yield as well as instrumental drift (Longerich et al., 1996).
Description of a typical silicate LAM-ICP-MS analysis
Analyses of silicates are generally made over 3-4 minutes with over 100 replicates. Each replicate is a sweep of the mass range with dwell times of 50-100 ms on each peak. Figure 2.13. shows a typical run; the signal is made up of three parts. The first part typically consists of 40 to 60s during which the background is measured on pure gas. Then the laser is turned on and ablation starts, the signal rapidly builds up and reaches a steady state. This portion of the signal part is typically the one integrated, but if the sample shows zonation or inclusions several parts can be selected and processed independently. Then the laser is turned off, and the signal decreases rapidly as all remaining particles are flushed out of the sample cell. For olivine analyses, longer background times and wash-out times are used to improve the detection limits.
Data processing
The data obtained for all silicates have been processed with the GLITTER software package (van Achterbergh et al., 1999), which allows both on-line and off-line processing of the signal (Figure 2.13).
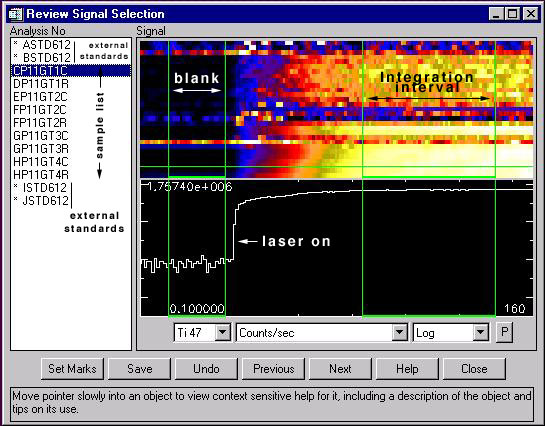
Figure 2.13: Typical laser run.
Typical laser run, shown as the review signal selection window of GLITTER which displays (centre-right) the log of the total counts per second for a given mass (here 167Er) versus time (X coordinate). The upper right part of the window displays through a colour grade (black to white) the counts per second for all masses analysed. Further information on this software can be found at http://www.es.mq.edu.au/GEMOC/
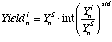
In LAM-ICPMS analysis, normalisation of the response for an analyte to an internal standard is necessary to obtain quantitative analyses. This internal standard commonly is a minor isotope of a major element, the content of which has been determined by an external method (e.g. electron probe). Trace element concentrations are calculated using the following equations:
 (eq 3.5), where:
 is the concentration of element i in analysis n,
 is the mean count ratio (background subtracted) of isotope j in element i in analysis n,
 , natural abundance of isotope j of element i.

 is the yield of element i in analysis n, calculated as follows:
 (eq. 3.6), where:
 is the counts per ppm of the internal standard S (eg. 44Ca, 25Mg, 34S, 61Ni) in analysis n.
 is the ratio of the yield of element i in analysis n to the yield of the internal standard S in analysis n, interpolated over the standard analyses.
The minimum detection limit at 99% confidence level is determined by Poisson counting statistics:
 (eq. 3.7)
Where:
 id the detection limit at 99% confidence level for element i for analysis n
 is the count rate for of element i for the background interval of analysis n.
Detection limit, Accuracy, Standards
The detection limits have improved significantly during the course of this study, from ICPMS to ICPMS and between ablation in Ar and He atmospheres. Table 2.1.3 highlights this evolution.
The long-term stability and accuracy of the various LAM-ICPMS systems used during this study have been assessed and checked daily by comparing values obtained for the standard glasses (NIST 610 and 612) relative to certified or published values. Agreements are excellent within 2% (1SD).
Table 2.1.3: Detection limits for the different LAM-ICPMS settings, for selected elements representative of the range of elements analysed during this study.
| settings | Ba | Ta | La | Sm | Lu | Sr | V | Ni |
| ppm | ||||||||
| PE 5100 Ar only? | 0.06 | 0.03 | 0.05 | 0.20 | 0.03 | 0.08 | 0.3 | 1.8 |
| ppb | ppm | |||||||
| PE 6000 Ar+He | 33 (7) | 20 (3) | 29 (4) | 85 (12) | 19 (3) | 45 (6) | 0.2 (0.04) | 0.9 (0.1) |
| HP 4500 Ar+He | 23 (4) | 40 (2) | 12 (2) | 53 (6) | 16 (2) | 36 (2) | 0.2 (0.02) | 0.6 (0.04) |
Average detection limit (best detection limit achieved), ? data from Norman et al. (1996)
The accuracy and precision achievable in routine analysis is illustrated in Table 2.1.4.
Table 2.1.4: LAM-ICPMS analyses of BCR-2 Basalt Standard (prepared as glass)
| BCR-2 | BCR-2G | BCR-2G | Merchantek LUV266 | |||
| Wilson | Jackson | Norman | Agilent 7500 | |||
| avge (n=8) | rsd | |||||
| Li | ppm | 9.98 | 9.21 | 3.46% | ||
| CaO | wt% | 7.12 | 7.14 | 7.14 | 0.00% | |
| Sc | ppm | 33 | 32.6 | 33.0 | 35.2 | 0.46% |
| TiO2 | wt% | 2.26 | 2.24 | 2.29 | 2.20 | 1.70% |
| V | ppm | 416 | 407 | 414 | 368 | 2.84% |
| Ni | ppm | 13 | 10.8 | 10.8 | 6.69% | |
| 14.2 | 5.29% | |||||
| Cu | ppm | 19.4 | 15.5 | 5.27% | ||
| Ga | ppm | 23 | 22 | 22.7 | 18.6 | 5.42% |
| Rb | ppm | 48 | 47.51 | 49 | 39.8 | 3.47% |
| Sr | ppm | 346 | 337 | 342 | 328 | 0.80% |
| Y | ppm | 37 | 32.51 | 35.3 | 35.4 | 0.80% |
| Zr | ppm | 188 | 184.4 | 194 | 191 | 0.98% |
| Nb | ppm | 13.14 | 12.8 | 11.8 | 1.32% | |
| Ba | ppm | 683 | 684 | 660 | 627 | 1.16% |
| La | ppm | 25 | 25.3 | 24.5 | 27.7 | 1.34% |
| Ce | ppm | 53 | 53.6 | 50.5 | 50.7 | 1.31% |
| Pr | ppm | 6.8 | 6.83 | 6.8 | 6.76 | 1.00% |
| Nd | ppm | 28 | 28.63 | 29.0 | 30.6 | 1.18% |
| Sm | ppm | 6.7 | 6.67 | 6.6 | 7.01 | 1.51% |
| Eu | ppm | 2.0 | 2 | 1.9 | 2.12 | 1.09% |
| Gd | ppm | 6.8 | 6.8 | 6.5 | 6.98 | 1.94% |
| Tb | ppm | 1.07 | 1.04 | 1.16 | 1.19% | |
| Dy | ppm | 6.38 | 6.5 | 6.81 | 1.82% | |
| Ho | ppm | 1.3 | 1.45 | 1.88% | ||
| Er | ppm | 3.66 | 3.6 | 3.80 | 2.29% | |
| Tm | ppm | 0.55 | 2.15% | |||
| Yb | ppm | 3.5 | 3.34 | 3.5 | 3.70 | 1.96% |
| Lu | ppm | 0.51 | 0.51 | 0.51 | 0.58 | 1.55% |
| Hf | ppm | 4.8 | 5.17 | 5.0 | 5.41 | 2.33% |
| Ta | ppm | 0.78 | 0.78 | 0.72 | 2.77% | |
| Pb | ppm | 11 | 10.34 | 11.5 | 7.17 | 5.64% |
| Pb | ppm | 11 | 10.34 | 11.5 | 6.92 | 5.81% |
| Th | ppm | 6.2 | 5.98 | 6.1 | 6.73 | 5.35% |
| U | ppm | 1.69 | 1.7 | 1.73 | 1.66 | 2.78% |
3.2 Sulfides
There are several difficulties in analysing sulfide minerals in mantle rocks by LAM-ICPMS:
- the small size of the grains
- the difficulty of obtaining an accurate internal standard
- the lack of external standards with sulfide matrices.
The method developed to overcome these difficulties is outlined below.
Outline of the technique
Because of the overall small size of sulfide blebs in mantle samples (usually <50 um) and of the ablation characteristics of the sulfide, the laser ablation usually destroys the whole sulfide grain. Sulfides commonly exsolve at low temperature into several phases having different compositions, which coexist in the same bleb: Ni-rich and/or Ni-poor pyrrhotite, pentlandite and chalcopyrite/isocubanite. However, quantitative analyses using the LAM-ICPMS method require the use of an internal standard (see data processing section). In the case of sulfide I have used S as the internal standard.
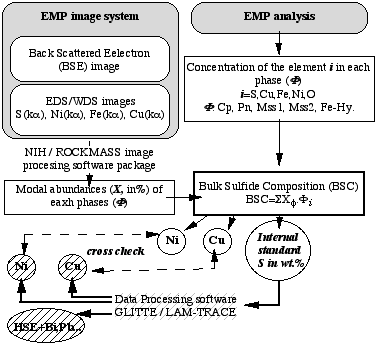
Figure 2.15: Flow chart describing the method for accurate internal standardisation for sulfide ablation
The proportion and the composition of each phase making up the sulfides grains must be determined prior to the LAM-ICP-MS analysis in order to determine the bulk chemistry of the grains (figure 2.15). This information was obtained by electron micro-probe analysis. The proportion of each phase was estimated using the Electron Dispersive System (EDS) imaging facility of the electron probe. The EDS images were then analysed using image processing software obtained from the US National Institute of Health, or ROCKMAS, an in-house software developed by E. van Achterbergh, to determine the relative area (mode) of each phase. Electron microprobe analysis of each phase was combined with these modal analyses to calculate contents of S, Cu, Ni, Fe, Co and O in the bulk sulfide. A cross-check on the accuracy of the internal standard is given by comparison between the Ni and Cu contents given by the LAM-ICPMS analysis and those obtained through the combination of electron micro-probe and image processing. Discrepancies between Cu and Ni contents derived from the two methods may reflect either errors in the modal analysis or, more probably, variation in the abundances of phases with depth. In order to evaluate these two effects, special attention has been paid to the ratios of Cu/Ni, Ni/Fe and Ni/S in the raw LAM-ICPMS signal to track any modal variation with depth.
Table 2.14: Analyses of the PGE-A sulfide standard
| Element | Doped with ? | PIXE * | EMP ** | LAM-ICP-MS 1 | LAM-ICP-MS 2 |
| N# | 4 | 7 | 172 | 31 | |
| Ni (wt%) | 65.5 | 71.5±0.5 | 71.7±3.4 | 71.0±3.0 | |
| S | 34.5 | 27.8±0.4 | 28.8±2.5 | 27.8±3.1 | |
| Fe | 0.09 | <0.015 | 0.04±0.04 | 0.02±0.01 | |
| O | 0.26±0.09 | - | - | ||
| Cu (ppm) | 2283 (n=1) | <0.026 | 2464±352 | 1999±460 | |
| As | 199.4 | 136±5? | 422±116 | 131±6 | 131±3 |
| Se | 240.8 | 244±11 | 335±309 | 236±13 | 229±6 |
| Ru | 193.8 | 226±26 | 205±11 | 205±15 | |
| Rh | 201.3 | 235±31 | 223±12 | 219±16 | |
| Pd | 225.2 | 310±68 | 274±13 | 268±16 | |
| Ag | 185.2 | 241±10 | 360±118 | 229±11 | 220±12 |
| Cd | 198.0 | 34±3 | 31±2 | 30±2 | |
| Te | 194.7 | 235±17 | <220 | 207±36 | 202±22 |
| Re | none | n.a. | < 3ppb | - | |
| Os | 194.2 | 180±96 | 199±9 | 204±14 | |
| Ir | 208.4 | 103±52 | 211±12 | 212±14 | |
| Pt | 195.1 | 122±16 | <660 | 124±7 | 124±9 |
| Au | 212.4 | 234±13 | 503±367 | 212±11 | 209±9 |
| Pb | 96.2 | 43±12? | 29±2 | 29±2 | |
| Bi | 204.0 | 269±52 | <1300 | 211±9 | 204±10 |
? PGE-A has been made by I. Horn & S.E. Jackson.
*: Proton Probe analysis carried out at CSIRO, (North Ryde, Sydney, Australia) by C.G. Ryan. Detection limits for HSE are (in ppm) Ru: 1.5, Rh: 1.6, , Pd: 1.8, Ag :2.0, Ir: 27, Pt: 19, Au: 13, Bi: 12. ? indicates that 1SE (error on individual analysis) is higher than 1sd (standard deviation for 4 analyses)
**: analyses performed at Macquarie University using a Cameca SX50. Operating conditions were: sample current 20 nA, accelerating voltage 20 kV, spot size 10µm, counting time on peak and off peak are 10s for Ni, S and O, 60s for Fe, and Cu and Co, 120s for Zn, Pt, Au, Bi, Se, As, Ag, Te.
1: PGE-A average all runs, all analyses included
2: PGE-A as an unknown normalised to PGE-A as a known standard
€.: These values were adopted early in this study; the data collected during this study suggest that slight revision will be needed. However, these revisions are minor and in order to produce a consistent data set these values have been used throughout this study.
External standard
Microprobe analysis at trace levels requires reliable standards. The standard used during this study was PGE-A, a doped quenched NiS bead produced by Ingo Horn and Simon E. Jackson. The fact that this standard has a sulfide matrix allows a straightforward and robust calibration. However, as highlighted in section 2.1.5, the yield of the NiS fire assay technique can be variable, especially for elements as Pd, Os or Au, and are almost unknown for volatile siderophile-chalcophile elements (eg. Cu, Zn, As, Se, Te) A detailed characterisation of this standard therefore has been carried out using PIXE (Nuclear Micro-Probe analysis), EMP and LAM-ICP-MS. Table 2.15 summarises the results of these investigations. This table demonstrates the long term stability of this standard. Indeed, the standard deviation of about 5% for most of the PGE demonstrates that trace elements are homogeneously distributed in the standard. Fe is unreliable and Te shows a greater spread than other elements. A large part of this scatter seems to be related to occasional Te spikes related to the ICP-MS rather than to the presence of Te-nuggets in the standard itself. This conclusion is also supported by NMP analyses (Table 2.15) showing a rather constant Te concentration (235±17 ppm).
Mass interferences
ICP-MS analysis is subject to isobaric and polybaric interferences. Most of these mass interferences could be avoided by selecting isotopes free of such effects. In some cases it is difficult to find such an isotope, either because the element in question is mono-isotopic or because each isotope is affected by mass interferences. However, a properly tuned ICP-MS has a limited production rate of polyatomic species. The ICPMS instruments used during this study were tuned to have a ThO production less than to 1%. Therefore in a dry plasma mass interferences are significant only for major or minor elements, typically with levels of >0.5 wt% combined with abundant air and carrier gas species (ie 40Ar, 16O, 14N, 4He).
Table 2.1.5 reviews all possible interferences with major elements usually found in sulfides. From this table it is clear that polyatomic mass interferences will be important mainly for Rh and Ru. 103Rh (mono-isotopic) suffers from 40Ar63Cu interference, and the two abundant isotopes of Ru (99Ru, 101Ru) have major interferences from 40Ar59Co and 40Ar61Ni. Co is usually a minor element in sulfide (20.5%), but it is mono-isotopic and may have a higher abundance in some specific sulfides. 16O59Co may interfere on 75As, the only available isotope of As.
In solution ICPMS mass interferences are usually corrected using synthetic solutions having only the elements responsible for interference, e.g. Ba2+ solution is used to estimate spurious Eu+ production or a Cu solution to estimate the production rate of 40Ar63Cu interfering on 103Rh. Similarly, we have ablated, at the beginning and end of each laser run, a pure (99.99%) Cu standard (JMC976 Cu) in order to estimate the production rate of 40Ar63Cu.
Table 2.1.5. Possible poly-atomic interferences for sulfide laser ablation (dry plasma)
| Element | 40Ar (99.6) | 16O (99.76) | 14N | 4He (99.99) |
| 32S(95.02) | 62 Ni(3.63) | 48 Ti, Ca | 46 Ti,Ca | 36 S(0.02) |
| 34S(4.21) | 74 Se(0.89) Ge(35.94) | 50 Ti,V,Cr | 48 Ti, Ca | 38 Ar |
| 54Fe(5.8) | 94 Mo(9.25), Zr | 70 Zn (0.6), Ge(21.23) | 68 Zn (88.8) | 58 Fe(0.28), Ni(68.08) |
| 56Fe(91.72) | 96 Mo(16.66), Ru(5.52),Zr | 72 Ge(27.66) | 70 Zn (0.6), Ge(21.23) | 60 Ni(26.22) |
| 58Ni(68.08) | 98 Mo(24.13), Ru(1.88) | 74 Se(0.89) Ge(35.94) | 72 Ge(27.66) | 62 Ni(3.63 |
| 59Co (100) | 99Ru() | 75As(100) | 73 | 63Cu(30.83) |
| 60Ni(26.22) | 100 Mo(9.63), Ru(12,6) | 76 Se(9.36), Ge(7.44) | 74 Se(0.89) Ge(35.94) | 64 Zn(48.6),Ni(0.93) |
| 61Ni(1.14) | 101 Ru(17.0) | 77 Se (7.63) | 75 As(100) | 65 Cu(30.83) |
| 62Ni(3.63) | 102 Pd(1.02), Ru (31.6) | 78 Se(23.78),Kr | 76 Se(9.36), Ge(7.44) | 66 Zn(27.9) |
| 63Cu(69.17) | 103 Rh(100) | 79 Br | 77 Se (7.63) | 67 Zn(4.1) |
| 65Cu(30.83) | 105 Pd(22.33) | 81 Br | 79 Br | 69 Ga(60.18) |
Numbers in brackets are natural isotopic abundances; elements in bold font are those where corrections are necessary; isotopes in normal font are elements of interest for sulfide analysis, but where other isotopes free of interference are available. Isotopes in grey font are not relevant to sulfide analysis.
103Rh, 105Pd and CuAr interferences
Because Cu is a major element in sulfides (especially in chalcopyrite) it is necessary to correct 103Rh for the contribution of CuAr. 105Pd also suffers from a 40Ar65Cu interference, but other masses, free of interferences, are available for Pd. Pure Cu metal was ablated at the beginning and end of each LASER session to construct a calibration curve (depending on the analytical conditions) for this effect. Figure 2.15 and 2.16 demonstrates that the CuAr production rate is very stable through time and is essentially independent of laser beam energy. This stability probably reflects the very constant day-by-day ICPMS setting.
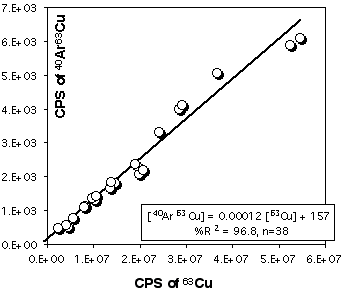
Figure 2.16. Interference of 40Ar65Cu on 105Pd. The calibration curve has been obtained by ablating pure Cu metal (JMC976). The X and Y axes show raw count rates. This calibration curve has been obtained for the PE6000 ICP-MS and for ablation in He atmosphere. The range of Cu intensity has been produced by varying the energy of the laser beam only (at constant Å4Hz).
However this calibration cannot be exported to another ICP-MS, therefore similar procedures have been carried out for the HP 4500. Results for 63Cu40Ar production are presented in Figure 2.17
.
Figure 2.17. Interference of 40Ar63Cu on 103Rh for the Agilent HP4500 compared to result obtained for the Elan PE6000 . The calibration curve has been obtained by ablating pure Cu metal (JMC976). The X and Y axes show raw count rates. Ablation characteristics are identical to those used for the PE6000 calibration curve (Figure 2.16) the range of energy used is also similar.
The low rate of ArCu production illustrates the point that significant polyatomic mass interference are fairly limited and is significant only when they involve major elements and abundant isotopes. This implies that masses higher than 105 (40Ar65Cu) can be considered as almost free of polyatomic mass interferences when sulfides are analysed under dry plasma conditions, as is the case in laser-ablation analysis.
Reproducibility, accuracy.
The reproducibility of PGE-A analyses can be seen from Table 2.14. This table shows the range and mean of this standard analysed as an unknown after calibration against this same standard. These analyses were conducted over a 2-year period as part of the routine analysis of unknowns. They demonstrate a long-term stability, given that variability is under 5-10%.
Detection limit
Detection limits are reported in Table 2.16. The benefit of He as a carrier gas is again very significant. The improvement using He as a carrier gas is notably greater than obtained for the silicates.
Table 2.16: Typical detection limits for LAM-ICP-MS: values are in ppm
| Setting | Os | Ir | Ru | Rh | Pd | Pt | Au |
|
PE6000 Ar only |
0.180 | 0.110 | 0.750 | 0.107 | 0.163 | 0.320 | 0.093 |
|
PE 6000 He +Ar |
0.019 | 0.018 | 0.070 | 0.024 | 0.036 | 0.039 | 0.040 |
|
HP4500 He+Ar |
0.046 (0.010) | 0.039 (0.008) | 0.150 (0.035) | 0.046 (0.007) | 0.081 (0.015) | 0.060 (0.014) | 0.033 (0.006) |
Bracketed values are best detection limit achieved during a typical day (Å60 analyses).
Comparison with other methods
Comparison with proton probe analyses was possible for a small number of sulfides. Proton probe data for Udachnaya sulfides were available (C.G. Ryan and W.L. Griffin, pers. comm.) and data for two sulfides from Mtf37 were acquired (courtesy of C.G. Ryan). These data are reported in Table 2.1.7 along with LAM-ICP-MS data. Overall good agreement is obtained for most of the elements analysed.
Table 2.1.7: LAM-ICP-MS data compared to NMP data.
| Sample | Os | Ir | Ru | Rh | Pt | Pd | Ag | Pb | Se | |
| MTF37-1 | NMP | n.a. | n.a. | 19.6±1.4 | 1.7±1.2 | 9.3±9 | 4.8±1.3 | 8.6±1.6 | 10.7±5.3 | 43±4 |
| LAM | 23.6±3.5 | 2.6±0.3 | 0.1 | 3.4±0.3 | 0.1 | 2.8±0.4 | 82±10 | |||
| MTF37-3 | NMP | n.a. | n.a. | 20.5±1.4 | 2.9±0.6 | 18.5±8.7 | 8.6±1 | 5.5±0.9 | 6.7±0.8 | 92±4 |
| LAM | 19.7±2.1 | 1.9±0.3 | 2.1±0.3 | 10.9±1.3 | 6.1±0.7 | 4.6±0.4 | 92±11 | |||
| UD- Ol61 | NMP | 892±126 | 712±70 | 517±19 | 73±8 | <55 | <12 | n.g. | n.g. | n.g. |
| LAM* | 829±7 | 1076±39 | 527±5 | 65±10 | 107±16 | 3±4 |
NMP, Nuclear Microprobe analysis, courtesy of C. Ryan; LAM: LAM-ICP-MS analysis; errors are 1se except for Ud-Ol61 where error for LAM data are 1sd; n.a., not analysed, n.g., not given.
References
Longerich H.P., Fryer B.J. and Strong D.F. (1987) Determination of lead isotope ratios by inductively coupled plasma-mass spectrometry ICPMS. Spectrochim. Acta 42B, 39-48
Norman, M. D., Pearson, N.J., Sharma, A and Griffin,W.L., 1996. Quantitative analysis of trace elements in geological materials by laser ablation ICPMS: instrumental operating conditions and calibration values of NIST glasses. Geostandards Newsletter, 20, 247-253.
Norman M.D., Griffin W. L., Pearson N. J., Garcia M. O., and O'Reilly S. Y. 1998. Quantitative analysis of trace element abundances in glasses and minerals: a comparison of laser ablation ICPMS, solution ICPMS, proton microprobe, and electron microprobe data. Journal of Analytical Atomic Spectroscopy 13, 477-482.
Van Achterberg E., Ryan C.G. and Griffin W.L. (1999). Glitter: on line intensity reduction for the laser ablation inductively coupled plasma mass spectrometry, 9th Goldschmidt Conf., pp. 305, Boston M.A.
4. Whole-rock isotopic analysis (MC-ICPMS)
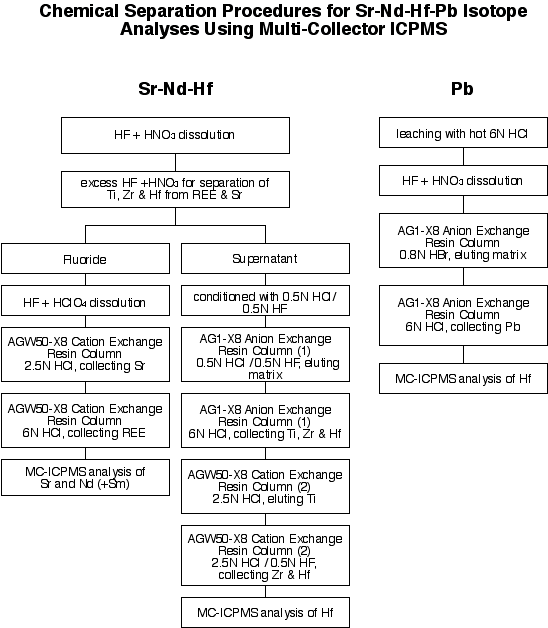
4.1 Sr-Nd-Hf-Pb analysis
4.1.1 Chemistry
The chemical separation procedure is outlined below.
4.1.2 Mass spectrometry (MC-ICPMS)
The simplified chemistry described above, and especially the separation of a Sm+Nd cut for simultaneous analysis of Sm/Nd and Nd isotopic composition without spiking, relies on the ease with which isobaric interferences can be corrected to high precision in ICPMS analysis. This procedure also depends on the use of an external normalisation procedure whereby the mass fractionation coefficient measured on one element is used to correct the mass discrimination of an element of similar mass (e.g., Tl to correct Pb, Longerich et al., (1987), Walder and Furuta (1993), Rehkämper and Halliday (1998), Belshaw et al. (1998); Sr to correct Rb, Christiansen et al. (1995); Nd to correct Sm, Luais et al. (1997); Hf to correct Yb and Lu, Griffin et al. (2000)). The method assumes that the mass fractionation coefficients for both elements are equal, and allows the adjustment of the 'true' isotope ratios of either the normalising element or the interfering element. Rehkämper and Halliday (1998) and Belshaw et al. (1998) adjusted the 'true' 205Tl/203Tl ratio to obtain better agreement with TIMS Pb isotopic analyses. Griffin et al. (2000) analysed Hf solutions spiked with Lu and Yb to obtain the 'true' Lu and Yb isotopic compositions necessary to correct the 176Lu/176Hf and 176Yb/176Hf overlaps and give the true 176Hf/177Hf ratio.
The validity of the assumption that the ratio of the mass fractionation coefficients equals one has been tested by Maréchal et al. (1998) for Cu and Zn, and by White et al. (2000) for Tl and Pb. Both studies were conducted on a VG Plasma54 instrument, and concluded that the fractionation coefficients for each pair of elements were not identical, but remained 'constant over the course of an analytical session'. White et al. (2000) reported differences in the ratio of the fractionation coefficients for Tl and Pb for experiments carried out several months apart and argued that adjustment of 'true' isotopic ratios did not overcome the difference in fractionation coefficients. Despite intensive testing over two years, these long term fluctuations in the mass fractionation coefficient ratios have not been observed on the Nu Plasma instrument (authors' unpub. data). This stability justifies the approach of Belshaw et al. (1998) and Griffin et al. (2000) in fixing the isotopic ratio of one element to provide a mass discrimination correction for a second element.
Table 1. MC-ICPMS analyses of isotopic standards
| Hafnium | |||||||||||
| 176/177 | 1se | 178/177 | 1se | 180/177 | 1se | ||||||
| JMC 475 | |||||||||||
| average | n=124 | 0.282161 | 0.000005 | 1.467253 | 0.000009 | 1.886744 | 0.000022 | ||||
| 2sd | 0.000014 | 0.000033 | 0.000096 | ||||||||
| Neodymium | |||||||||||
| 142/144 | 1se | 143/144 | 1se | 145/144 | 1se | 148/144 | 1se | ||||
| JMC 321 | |||||||||||
| average | n=68 | 1.141829 | 0.000035 | 0.511132 | 0.000010 | 0.389304 | 0.000009 | 0.241534 | 0.000015 | ||
| 2sd | 0.000149 | 0.000040 | 0.379923 | 0.000066 | |||||||
| JMC 321 + JMC309 Sm | |||||||||||
| average | n=18 | 1.141703 | 0.000026 | 0.511108 | 0.000006 | 0.389427 | 0.000006 | 0.241301 | 0.000009 | ||
| 2sd | 0.000084 | 0.000017 | 0.000017 | 0.000310 | |||||||
| Strontium | |||||||||||
| 87/86 | 1se | ||||||||||
| NBS 987 | |||||||||||
| average | n=71 | 0.710263 | 0.000012 | ||||||||
| 2sd | 0.000038 | ||||||||||
| GEMOC Sr | |||||||||||
| average | n=34 | 0.707616 | 0.000012 | ||||||||
| 2sd | 0.000066 | ||||||||||
| GEMOC Sr + Rb | |||||||||||
| average | n=16 | 0.707647 | 0.000010 | ||||||||
| 2sd | 0.000068 | ||||||||||
| Lead | |||||||||||
| 208/204 | 1se | 207/204 | 1se | 206/204 | 1se | 208/206 | 1se | 207/206 | 1se | ||
| NBS 981 | |||||||||||
| average | n=40 | 36.6986 | 0.0023 | 15.4917 | 0.0010 | 16.9376 | 0.0014 | 2.16685 | 0.00004 | 0.91471 | 0.00002 |
| 2sd | 0.0090 | 0.0035 | 0.0046 | 0.00015 | 0.00005 | ||||||
| Todt et al., (1996) TIMS | 36.7006 | 15.4891 | 16.9356 | 2.16701 | 0.91459 | ||||||
| Belshaw et al., (1998) | 36.6710 | 15.4830 | 16.9290 | 2.16610 | 0.91455 | ||||||
| Rehkämper & Halliday (1998) | 36.6671 | 15.4818 | 16.9295 | 2.16589 | 0.91438 | ||||||
| White et al., (2000) | 36.6826 | 15.4899 | 16.9467 | 2.16460 | 0.91404 | ||||||
Table 2. Analyses of reference materials
| Compilation of Sr-Nd-Pb isotope compositions for standard basalt samples run by MC-ICPMS at GEMOC | ||||||||
| Sr isotope standard: BCR-1 | 87Sr/86Sr | 2sd | ||||||
| Average (n=8) | 0.70504 | 1.0E-05 | ||||||
| Price et al. (2000) ave. (n=6) | 0.70500 | 4.0E-05 | ||||||
| Nd isotope standard: BCR-1 | 143Nd/144Nd | 2sd | 147Sm/144Nd (measured) | 2sd | ||||
| BCR-1 ave (n=10) | 0.512653 | 2.6E-05 | 0.1464 | 3.2E-05 | ||||
| Thirlwall (1991) ave. (n=8) | 0.512643 | 9.0E-06 | ||||||
| Pb isotope standard: BCR-2 | 206Pb/204Pb | 2sd | 207Pb/204Pb | 2sd | 208Pb/204Pb | 2sd | ||
| Average (n=9) | 18.756 | 0.007 | 15.620 | 0.004 | 38.713 | 0.020 | ||
| Woodhead per. com. Ave. (n=4) | 18.750 | 0.009 | 15.615 | 0.003 | 38.691 | 0.018 | ||
| Pb isotope standard: BHVO-2 | ||||||||
| Average (n=10) | 18.632 | 0.031 | 15.527 | 0.008 | 38.212 | 0.029 | ||
| Woodhead per. com. Ave. (n=4) | 18.641 | 0.017 | 15.538 | 0.007 | 38.228 | 0.022 | ||
Hf isotopes
Masses 172, 175, 176, 177, 178, 179 and 180 are analysed simultaneously (static-collection mode) in Faraday cups. Data were normalised to 179Hf/177Hf = 0.7325, using an exponential correction for mass bias. Any interference of 176Lu on 176Hf, arising from incomplete separation, is corrected by measuring the intensity of the interference-free 175Lu isotope and using 176Lu/175Lu = 0.02669 to calculate 176Lu/177Hf. Similarly, any interference of 176Yb on 176Hf is corrected by measuring the interference-free 172Yb isotope and using 176Yb/172Yb to calculate 176Yb/177Hf. The appropriate value of 176Yb/172Yb was determined by successive spiking the JMC475 Hf standard (1 ppm solution) with Yb, and iteratively finding the value of 176Yb/172Yb (0.5865) required to yield the value of 176Hf/177Hf obtained on the pure Hf solution. The measured 176Lu/177Hf ratios are used here to calculate initial 176Hf/177Hf ratios. The precision and accuracy of solution analyses with and without Yb is shown in Table 1.
Nd isotopes
Masses 143, 144, 145, 146, 147, 148, 150 are measured simultaneously in Faraday collectors and all measurements are made in static mode. An exponential correction for mass fractionation is applied using 146Nd/145Nd = 2.07204 to avoid an iterative correction for the interference of 144Sm on 144Nd. The value for 146Nd/145Nd is an average of results obtained on a 1 ppm JMC321 Nd solution and is normalised to 146Nd/144Nd = 0.7219. The interference of 144Sm on 144Nd was corrected by measuring 147Sm and using 144Sm/147Sm = 0.2070. This value was obtained by doping the JMC321 Nd standard solution with JMC309 Sm and by repeated measurement to refine the value of 144Sm/147Sm necessary to give the 'true' Nd ratio. Solutions with Sm:Nd ratios up to 0.1ppm Sm:1ppm Nd (144Sm/144Nd = 0.00013) were analysed in this procedure. Table 1 presents average analyses of unspiked and Sm-spiked JMC321.
Sr isotopes
Masses 83, 84, 85, 86, 87, 88 are measured simultaneously in Faraday collectors and all measurements were made in static mode. Corrections for mass fractionation of Sr and Rb isotope ratios are made using an exponential law using a normalising value for 86Sr/88Sr = 0.1194. The precision and accuracy of solution analysis of NBS 987 and QCD Analysts Sr standard (Lot No: 7Y38S700B2) are given in Table 1. Any interference of 87Rb on 87Sr is corrected by measuring the intensity of 85Rb and using a 85Rb/87Rb = 0.38632. This value was obtained by doping the QCD Analysts Sr standard with Rb (Plasmachem Lot No: S4JS3700) and by repeated measurement to refine the value of 85Rb/87Rb necessary to give the true 87Sr/86Sr. The maximum 87Rb/87Sr ratio of the spiked solutions used in the refinement of the 85Rb/87Rb ratio was 0.3977. Although 83Kr was monitored, the need for a correction for 86Kr interference on 86Sr was eliminated by measuring the background on peak and thus removing the gas blank from the signal.
Pb isotopes
The procedure used for Pb follows that described by Belshaw et al. (1998) for the Nu Plasma instrument. Masses 202, 203, 204, 205, 206, 207, 208 are measured simultaneously in Faraday collectors and all measurements were made in static mode. Thallium (NBS 997) is used to correct for mass fractionation using an exponential correction and a value of 205Tl/203Tl = 2.3875 (Belshaw et al., 1998). Results for NBS 981 are presented in Table 1, along with data by TIMS analysis (Todt et al., 1996) and MC-ICPMS determinations by Belshaw et al. (1998), Rehkämper & Halliday (1998) and White et al. (2000). A correction for the interference of Hg was applied to 204Pb in the solution analyses of NBS 981.
References
Belshaw N.S, Freedman P.A., O'Nions R.K., Frank M. and Guo Y. (1998) A new variable dispersion double-focussing plasma mass spectrometer with performance illustrated for Pb isotopes. Int. J. Mass Spec. Ion. Proc.181, 51-58.Christiansen J.N., Halliday A.N., Lee D.-C. and Hall C.M. (1995) In situ Sr isotopic analysis by laser ablation. Earth Planet. Sci. Lett. 136, 79-85.
Griffin W.L., Pearson N.J., Belousova E., Jackson S.E., O'Reilly S.Y., van Achterberg E. and Shee S.R. (2000) The Hf isotope composition of cratonic mantle: LAM-MC-ICPMS analysis of zircon megacrysts in kimberlites. Geochim. Cosmochim. Acta 64, 133-147.
Longerich H.P., Fryer B.J. and Strong D.F. (1987) Determination of lead isotope ratios by inductively coupled plasma-mass spectrometry ICPMS. Spectrochim. Acta 42B, 39-48
Luais B., Télouk P. and Albarède F. (1997) Precise and accurate neodymium isotope measurements by plasma-source mass spectrometry. Geochim. Cosmochim. Acta 61, 4847-4854.
Maréchal C., Télouk P. and Albarède F. (1999) Precise analysis of Cu and Zn isotopic compositions by plasma-source mass spectrometry. Chem. Geol. 156, 251-273.
Norman M.D., Pearson N.J., Sharma A. and Griffin W.L. (1996) Quantitative analysis of trace elements in geological materials by laser ablation ICPMS: Instrumental operating conditions and calibration values of NIST glasses. Geostandards Newsletter 20, 247-261.
Norman M.D., Griffin W.L., Pearson N.J., Garcia M.O. and O'Reilly S.Y. (1998) Quantitative analysis of trace element abundances in glasses and minerals: a comparison of laser ablation ICPMS, solution ICPMS, proton microprobe, and electron microprobe data. Jour. Analytical Atomic Spectroscopy13, 477-482.
Rehkämper M. and Halliday, A.N. (1998) Accuracy and long-term reproducibility of lead isotope measurements by MC-ICP-MS using an external correction of mass discrimination. Int. J. Mass Spec. Ion Proc. 58, 123-133.
Todt W., Cliff R.A., Hanser A. and Hofmann A.W. (1996) Evaluation of a 202Pb-205Pb double spike for high-precision lead isotope analysis. In: Earth Processes ó Reading the isotopic code (A. Basu and S.R.Hart, eds). Geophysical Monograph 95, American Geophysical Union, pp 429-437.
Walder A.J. and Furuta N. (1993) High precision lead isotope ratio measurement by inductively coupled plasma multiple collector mass spectrometry. Anal. Sci.9, 675-680.
Walder A.J., Abell I.D., Platzner I. and Freedman P.A. (1993) Lead isotope measurement of NIST610 glass by laser ablation inductively coupled plasma mass spectrometry. Spectrochimica Acta 48B, 397-402.
White W.M., Albarède F. and Télouk P. (2000) High-precision analysis of Pb isotope ratios by multi-collector ICP-MS. Chem. Geol.167, 257-270.
4.2 Re-Os analysis
This report was prepared by Dr. Stuart Graham. It summarises the GEMOC isotope-dilution method for Os concentration and 187Os/188Os ratio determination in geologic materials by Carius tube digestion and solvent extraction, and documents the accuracy and precision of the analyses for a variety of standards and natural samples.
The determination of the Os isotopic composition of mantle-derived rocks has resulted in the better understanding of mantle melting events, as the Os isotopic system has a two-fold potential: as an isotopic tracer and geochronometer. However, the determination of Os within a sample is difficult, as Os has a high ionisation potential and is present in the majority of silicate samples in the low ppb to ppt range. Hence, the accurate determination of Os requires preconcentration prior to mass spectrometric analysis. Previous methods of preconcentration have relied on fire-assay procedures in which the PGE are partitioned into a sulfide phase, and more recently on low blank Carius tube digestion. After fusion and digestion the Os is separated by a two step oxidising distillation to recover OsO4. However, fire-assay preconcentration results in a prohibitive blank for low-Os samples, and while the Carius tube digestion reduced the blanks considerably the distillation procedures result in a low Os yield, as the digested sample must be split into two for Re to be analysed. More recently Os separation has been achieved accomplished by utilising the affinity of Os for organic phases.
4.2.1 Chemistry
Sample preparation
Rock samples were sawn into cubes, washed with MQ-H2O and dried before being powdered using an agate TEMATM mill. The mill was cleaned between samples by crushing multiple aliquots of clean quartz, and pre-contaminated with an aliquot of sample.
Re and Os spike calibration
Rhenium (15µg) and Os (37µg) spikes were supplied by Dr. R.W. Carlson (DTM). The compositions of the enriched spikes are: 192Os = 1.903%, 190Os = 96.66%, 189Os = 0.8753%, 188Os = 0.5138%, 187Os = 0.0247%, 186Os = 0.0209% and 187Re = 2.597%, 185Re = 97.40%. To determine the concentration of Os in the spike solution a gravimetric Os standard solution was prepared by digesting the Johnson Mattey ammonium hexachlorosmate ((NH4)2OsCl6) salt in 8N HCl in a Carius tube. The standard solution was then mixed with a suitable amount of spike, sealed in Teflon beakers and placed in an oven at 90°C for 48 hours. Os concentrations were determined by MC-ICPMS in static mode (see below).
Re-Os chemical procedures
All Teflonware (PTFE beakers and bombs) was soaked in 6N HCl for at least 24 hours before boiling in ~30% HNO3. Glassware (Carius tubes and reaction vessels) was boiled in ~30% HNO3. Following boiling the Teflon and glassware were washed with 18.2 Mohm Millipore water (MQ-H2O). Concentrated HCl, HNO3 and HBr were distilled twice in Teflon stills using infrared lamps. Aristar grade chloroform and SupapurÒ H2SO4 were used as supplied by Merck and industrial grade carbontetrachloride was purified by sub-boiling distillation.
2.5 gram aliquots of whole rock (peridotite) and 0.02 to 0.5 gram (WPR-1) powders, along with 1 ml MQ-H2O, were loaded directly into Carius tubes. The sample and MQ-H2O were then frozen in the Carius tube before 190Os and 185Re tracer solutions and inverse aqua regia (16N HNO3:12N HCl = 2:1) were added. The contents of the Carius tubes were then allowed to freeze, and the tube was sealed using an oxy-LPG torch. The samples were then allowed to return to room temperature before being inserted into a steel protective casing and placed in the oven for 12-72 hours at 240°C to achieve spike-sample equilibration. After removal from the oven, and time to cool, the Carius tube was frozen in liquid N, opened and allowed to thaw. The aqua regia was then transferred to clean 50cc centrifuge tubes and centrifuged to remove the silicate residue.
The solution was then transferred to a clean 50ml centrifuge tube, to which 3ml of chilled chloroform (CHCl3), or carbontetrachloride (CCl4) were added. The solution was shaken using a vortex mixer for approximately 2 minutes before being centrifuged to ensure complete separation of CHCl3 from the aqua-regia. The CHCl3 was transferred to a 60ml teflon bomb, to which 4 ml 9N HBr had been previously added. This process was repeated three times. To facilitate the back-extraction of Os into the HBr, the bomb containing the HBr-CHCl3 was placed on a hotplate and heated to between 80-90 °C for one hour. A small aqua regia aliquot for Re analysis was reserved at this time in a 15 ml teflon bomb. After the Os samples had cooled the CHCl3 was discarded, the HBr transferred to a 7ml Teflon beaker and evaporated to dryness under heat lamps in a HEPA-filtered laminar-flow clean air cabinet. The resulting hexabromosmate salt was then ready to be picked up in sulphuric acid and sparged into the mass spectrometer.
The Re aliquot was evaporated to dryness between 100-150 °C. The surface temperature of the hotplate was monitored and initially kept at ~100 °C, when the potential for cross-contamination is high, but allowed to reach 150 °C when the volume of the Re aliquot had reduced significantly. When dry ~4ml of 16N HNO3 was added and this was dried down again. This step was repeated to ensure that all Os was oxidised and had been removed from the aliquot as volatile OsO4+ ions. The remaining sample cake was picked up in 0.1N HNO3 and purified by anion exchange chromatography using 1 ml of Bio-RadTM AG50Wx8 (200-400) mesh in Bio-RadTM 10 ml polypropylene columns. The eluted Re was dried and picked up in 10ml 0.1N HNO3 for analysis by quadrupole ICP-MS.
4.2.2 Mass spectrometry
Os was analysed using a Nu Plasma multi-collector ICPMS (MC-ICPMS). Re was analysed using an Agilent Technologies 7500 or 4500 ICPMS. Peak centering and the optimum torch position for maximum sensitivity on the MC-ICPMS were determined using a 92 ppb Os solution, that was vaporised by a CETAC MCN6000 microconcentric nebuliser. Once the peaks were centered and the sensitivity maximised, the MCN was disconnected, and the sparging system connected.
The hexabromosmate salt was picked up in 0.15ml 12N H2SO4. This solution was loaded into a custom designed pyrex reaction vessel, to which a small amount of Nochromix® had been added. Nochromix® enhances the oxidation of Os to its highest valence state, Os8+, and the absence of this material in the reaction vessel significantly reduces the Os signal. The reaction vessel was placed in a custom made holder attached to a vortex mixer. The Nalgene exit gas line and vessel were heated to ~100oC using heating tape (Fig. 1). As the carrier gas does not pass through the solution the surface layer during sparging becomes depleted in Os and the signal intensity decreases. To ensure that this layer does not form it is necessary to constantly mix the solution. During the study period there was no difference between the intensity of the signal on the mass spectrometer when using chloroform or carbontetrachloride.
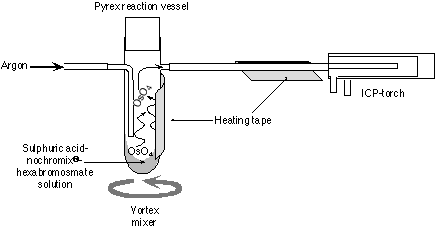
Figure 1. Schematic diagram of the set-up for Os sparging into the MC-ICPMS
At the start of each run, prior to loading the sample, the argon gas flow through the injector of the ICPMS torch was reduced until it tripped the mass spectrometer. Once the trip occurred, the reaction vessel cap was removed and the H2SO4-Nochromix® -hexabromosomate solution added, via a pipette. The cap was then quickly replaced, the vortex mixer switched on and the nebuliser flow increased. Os signals were immediately detected and monitored visually using the Nu Plasma time resolved software. Following signal acquisition a previously prepared reaction vessel was connected to the gas flow and the mass spectrometer monitored until background voltages on the Faraday cups were detected. Background intensities were usually reached within 15 minutes, although longer periods of time were required following samples that had high signal intensity.
Faraday cup acquisition
Sample acquisition was performed mostly using Faraday cups and Os signals could usually be detected over periods of 5-20 minutes. Moreover, while signal intensity was found to be dependent on the nanograms of Os in the procedure, the acquisition time was not. Hence both low and high-Os samples could provide running times of >10 min. 185Re was monitored throughout the runs to correct for interference of 187Re on 187Os. However, 185Re signal was negligible in every run. 194Pt was monitored to correct for any 192Pt-192Os and 190Pt-190Os interferences, but 194Pt was not detected during Os sparging. Measured Os isotopic ratios were then reported relative to 188Os. Mass fractionation correction and spike stripping were performed off line.
Triple ion counter acquisition
For samples with low Os concentrations, e.g., blanks, data were acquired using three ion counter collectors. The Nu Plasma MC-ICPMS has three ion counters that can be setup on a two-mass separation. This is ideal for counting Os isotopes in two cycles as it allows the simultaneous measurement of 192Os, 190Os, and 188Os in one cycle and 189Os, 187Os and 185Re in the other. All Os isotope ratios, apart from 186Os/188Os, can therefore be measured, and any interference of 187Re on 187Os could be corrected. As with the faraday acquisition, Os signals could usually be detected over periods of 5-20 minutes. The ion counters drifted relative to each other during the first hour of receiving ions. However, after one hour settling time the ion counters were observed to be stable over periods of five hours allowing the analysis of up to ~10 samples. Mass fractionation correction and spike stripping were performed off line.
Re mass spectrometry
Re isotopic data (185Re and 187Re) were measured on electron multipliers using either the Agilent 4500 or 7500 ICPMS. Samples were interspersed with a Re standard solution every 5 samples to monitor drift and fractionation. Both drift and fractionation were found to be negligible. Data reduction was performed off line.
Os memory
Osmium is known for its ability to diffuse into plastics and hence has a strong memory effect in ICPMS tubing. We also observed a strong memory effect in the MCN. Washout times for the 190Os isotope using the MCN are in the order of 30 minutes. The memory of the sparging technique described above is lower and requires on the order of 10-15 minutes washout.
Between sample analyses the next reaction vessel to be used, with its Nochromix® added, was attached to the gas line and Ar pumped through the vessel, at the same rate used when collecting data. Once the background had returned to zero, the H2SO4 solution containing the next sample could be added. Os did not appear to be strongly adsorbed to the Nalgene or Teflon tubing. However Os was observed to cause a memory problem in the torch, probably in the injector. "Stuck" Os was detected by an extended period to reach background. Furthermore if a H2SO4 - Nochromix® solution was sparged, the signal from the adhered Os could be measured for periods of >40 min using the ion counters, and this signal was identified as the standard, suggesting that contamination may have occurred during set-up. In contrast to the samples that would immediately register Os ions on the Faraday cups, the signal from "stuck" Os would gradually increase over a period of 20-30 minutes. We assume that during this time the acid vapors were gradually removing more and more Os from the surface until equilibrium was achieved. The only solution to the "stuck" Os problem is to replace the torch with a clean one, hence it is important to continually have a clean torch available.
4.2.3 Results
Re-Os blanks
Osmium and Re concentrations and isotopic ratios recorded during the study period are reported in Table 1. The Os blank of ~5 pg has essentially remained constant, and the Re blank has in general decreased through the study period. The reduction of the Re blank in the second part of the study period (samples B004 and B005) is attributed to the use of doubly distilled acids. The Re and Os blank values reported here are comparable to those in the literature. For the majority of the samples reported here the blank correction is insignificant.
Table 1. Re-Os Blanks
| Os pg | Re pg | 187Os/188Os | 187Re/188Os | |
| B-001 | 5.7 | 12 | 0.292 | 13.4 |
| B-002 | 3.8 | 8.4 | 0.329 | 8.09 |
| Average | 5.3 | 8.9 | 0.233 | 8.01 |
| Reagent | weight, g | total Re, pg | blank, pg | |
| HCl, 1IR | 10 | 0.734 | 0.007 | |
| HNO3, 1IR | 10 | 0.6378 | 0.064 | |
| HCl, 2IR | 10 | 0.4060 | 0.041 | |
| HNO3, 2IR | 10 | 0.3651 | 0.037 | |
Inter-laboratory comparisons
Ammonium hexabromosmate (JMC) standards
Table 2 shows Os isotope ratios for standards collected using different methods (MCN and Sparging using MC-ICPMS and N-TIMS). The Os standards were prepared using different batches of Johnson-Mattey ammonium hexachlorosmate salt. The 187Os/188Os cannot be directly compared, but the Os stable isotope ratios can be. At GEMOC there are three JM Os standards; DTM-187Os/188Os = 0.174, Bern-187Os/188Os = 0.107 and a standard prepared at GEMOC-187Os/188Os = 0.184. Of these the Bern and GEMOC standards are the only ones to have been sparged. For all the stable isotope ratios there is excellent agreement between the MCN and using the sparging methods. Moreover, there appears to be no mass spectrometer bias for our Nu Plasma ICPMS relative to TIMS.
Table 2. Inter-laboratory comparison, JMC standard solutions
| Laboratory | Collector | Number | 192Os/188Os | 190Os/188Os | 189Os/188Os | 187Os/188Os | 186Os/188Os |
| GEMOCa 92 ppb soln | FAR | 16 | 3.07977 ± 23 | 1.9827 ± 03 | 1.2194 ± 01 | 0.18364 ± 14d | 0.1204 ± 06 |
| VIEPS | FAR | 10 | 3.08271 | 1.9861 ± 26 | 1.2201 ± 03 | 0.17360 ± 48e | 0.1192 ± 05 |
| DTM | SEM analog | 13 | 3.08261 | 1.9832 ± 12 | 1.2196 ± 10 | 0.17396 ± 38e | 0.1203 ± 29 |
| GEMOCb 10ng | FAR-sparged | 4 | 3.08329 ± 164 | 1.9841 ± 12 | 1.2198 ± 07 | 0.18256 ± 52d | 0.1201 ± 02 |
| GEMOC c 5 to 25 ng | FAR-sparged | 10 | 3.08291 ± 99 | 1.9874 ± 84 | 1.2197 ± 04 | 0.10698 ± 12f | 0.1201 ± 09 |
| BERN 50 ng | FAR-sparged | 5 | - | - | - | 0.10694 ± 04f | 0.1198 ± 00 |
| GEMOC 92 ppb soln | FAR-off line correction | 10 | 3.08271 | 1.9846 ± 09 | 1.2207 ± 40 | 0.18357 ± 18d | 0.1204 ± 05 |
| GEMOC 1.5 ppb soln | 3IC's-off line correction | 22 | 3.08271 | 1.9923 ± 417 | 1.2216 ± 152 | 0.18353 ± 123d | - |
Note: all errors reported are 2 standard deviations. a, b and c are corrected for fractionation using a 189Os/192Os of 0.3923, all other samples are normalised either to 192Os/188Os = 3.08271 (VIEPS, GEMOC) or 3.08261 (DTM). d, e and f are JMC standard solutions prepared at GEMOC, DTM and Bern respectively. DTM and VIEPS data are from Lambert et al. 1998, Aust. Jnl. Earth Sci. 45, 265-284.
WPR PGE standard
Inter-laboratory comparisons for the WPR-1 PGE standard are presented in Table 3 and Figure 3. There is excellent agreement between our sparged MC-ICPMS Os and quadrupole ICPMS Re determinations and those determined by N-TIMS. The excellent agreement of Os and Re concentrations and 187Os/188Os and 187Re/188Os isotopic ratios shows that the methods used at GEMOC are sufficient to attain spike sample equilibration. One GEMOC WPR-1 analysis was performed using the triple ion counter method, and this sample shows excellent agreement to our other WPR-1 samples (see Table 5).
Previously measured geological materials
Five samples with a range of Os concentrations and Os isotopic compositions were selected for further inter-laboratory comparison (Table 4). There is in general excellent agreement of Re and Os concentrations and 187Os/188Os and 187Re/188Os isotopic ratios between the ICPMS-MC-ICPMS and TIMS samples. These data are summarised 1n Figure 4. For one sample, the Sutherland melnoite (259-001, 259-002), only 0.15ng of Os was digested in the Carius tube, and the results show that the GEMOC Re-Os laboratory is at present capable of analysing geologic materials with very low Os concentrations.
Table 3. Inter-laboratory comparison: WPR-1
| GEMOC: Os MC-ICPMS, Re ICPMS | |||||
| [Os] | [Re] | Re/Os | 187Os/188Os | 187Re/188Os | |
| MEAN | 16.78 | 11.63 | 0.69 | 0.14524 | 3.29783 |
| 2SE(M) | 0.28 | 0.09 | 0.01 | 0.00035 | 0.09386 |
| 2SE(M)% | 1.68% | 0.78% | 1.08% | 0.24% | 2.85% |
| Number | 17 | 13 | 13 | 22 | 13 |
| Minimum | 15.92 | 11.36 | 0.67 | 0.14388 | 2.77719 |
| Maximum | 18.29 | 11.93 | 0.72 | 0.14697 | 3.44845 |
| Os N-TIMS; Re N-TIMS | |||||
| [Os] | [Re] | Re/Os | 187Os/188Os | 187Re/188Os | |
| MEAN | 16.72 | 11.49 | 0.68 | 0.14521 | 3.26708 |
| 2SE(M) | 0.26 | 0.18 | 0.02 | 0.00089 | 0.08193 |
| 2SE(M)% | 1.55% | 1.56% | 2.33% | 0.61% | 2.51% |
| Number | 18 | 13 | 11 | 18 | 10 |
Note, Os and Re concentrations are reported in parts per billion.
Premier kimberlite
The Re-Os laboratory at Monash University determined duplicate Os abundances and 187Os/188Os isotopic ratios for the 1200 Ma Premier kimberlite from southern Africa. The Os data presented here are indistinguishable from one of the Monash analyses. One Monash sample with a high Os concentration (0.9 ppb) also has a lower Os isotopic composition, possibly suggesting the operation of the nugget effect through the presence of comminuted refractory lithospheric peridotite. Similar Os concentrations were determined for the GEMOC samples, although the isotopic compositions are indistinguishable, irrespective of Os concentration. Re concentrations and 187Re/188Os ratios for the Premier samples determined by the GEMOC laboratory are 50% lower than those determined by the VIEPS facility. For this sample both laboratories determine internally consistent Re concentrations. As both laboratories are able to produce indistinguishable Re concentration data for the WPR-1 peridotite this result suggests that Re in this sample is susceptible to the nugget effect.
Sutherland melnoite
The Re-Os laboratory at Monash University determined the Os abundance and 187Os/188Os isotopic ratio for a sample of the Sutherland melnoite, South Africa. The data from Monash show that this sample has a low Os concentration and a radiogenic 187Os/188Os ratio. The two samples analysed by GEMOC yield 187Os/188Os ratios and Os concentrations comparable to the VIEPS analyses. Errors on the 187Os/188Os ratio are better than those determined by N-TIMS, and this is significant because the MC-ICPMS analyses contained an order of magnitude less sample than the Monash analysis. Re data for the melnoite from both laboratories are comparable.
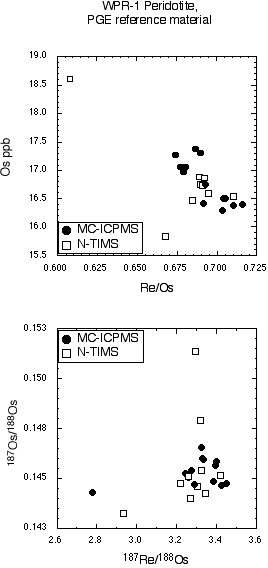
Figure 3. Re-Os concentration and isotopic data for the WPR-1 PGE reference material
Table 4. Inter-laboratory comparison: samples
| Spl wt, g | Os | error | Re | error | 187Os/188Os | error |
187Re/188Os |
error | |
| South Africa, Premier kimberlite | |||||||||
| K1/1102/A | 2.0199 | 0.965 | 0.015 | 0.127 | 0.010 | 0.14726 | 0.00073 | 0.6618 | 0.0499 |
| K1/1102/B | 2.1153 | 0.616 | 0.003 | 0.153 | 0.010 | 0.14926 | 0.00070 | 1.0375 | 0.0774 |
| Monash TIMS | 1.5019 | 0.703 | 0.003 | 0.256 | 0.001 | 0.14778 | 0.00136 | 1.8061 | 0.0181 |
| Monash TIMS | 1.5001 | 0.903 | 0.001 | 0.279 | 0.001 | 0.13359 | 0.00043 | 1.3808 | 0.0138 |
| South Africa, Sutherland melnoite | |||||||||
| MEL 259-001 | 0.5083 | 0.377 | 0.052 | 0.299 | 0.026 | 0.18455 | 0.00349 | 4.1246 | 0.3606 |
| MEL 259-002 | 0.5518 | 0.383 | 0.013 | 0.376 | 0.020 | 0.18365 | 0.00556 | 5.1401 | 0.3642 |
| Monash TIMS | 5.0332 | 0.340 | 0.002 | 0.259 | 0.001 | 0.17535 | 0.00765 | 3.7450 | 0.7604 |
| France, Massif Central | |||||||||
| PCV-9 | 1.4721 | 2.656 | 0.003 | 0.065 | 0.008 | 0.12292 | 0.00026 | 0.1331 | 0.0151 |
| PCV-9 | 2.0125 | 2.757 | 0.010 | 0.059 | 0.007 | 0.12478 | 0.00021 | 0.1129 | 0.0118 |
| PCV-9 | 1.5607 | 5.912 | 0.033 | 0.160 | 0.015 | 0.15631 | 0.00018 | 0.1370 | 0.0121 |
| PCV-9 | 2.5007 | 6.779 | 0.003 | 0.145 | 0.014 | 0.16033 | 0.00011 | 0.1062 | 0.0096 |
| Monash TIMS | - | 2.290 | - | 0.080 | - | 0.12380 | - | 0.1740 | - |
| Nancy TIMS | - | 2.530 | - | - | - | 0.12327 | - | - | - |
| France, Massif Central | |||||||||
| EG-9 | 2.071 | 3.082 | 0.005 | 0.164 | 0.008 | 0.12454 | 0.00026 | 0.2647 | 0.0118 |
| Nancy TIMS | - | 1.960 | - | 0.526 | - | 0.12760 | 0.00030 | 1.194 | - |
| France, Massif Central | |||||||||
| BO-3 | 2.0066 | 4.333 | 0.005 | 0.042 | 0.004 | 0.00967 | 0.00023 | 0.0532 | 0.0048 |
| Nancy TIMS | - | - | - | - | - | 0.14920 | 0.00180 | - | - |
Note: Os concentrations are reported in parts per billion, all errors are 2SEM. Italicised 187Re/188Os ratio is estimated.
Massif Central peridotites
Monash and the CRPG-CNRS, Nancy, France have measured Os abundances and 187Os/188Os isotopic ratios for samples from the Massif Central. Replicate analyses of the PCV-9 peridotite yield two groups of Os concentration and 187Os/188Os ratio. Two analyses yield Os concentrations and 187Os/188Os ratios indistinguishable from those determined at the CRPG-CNRS (Table 4, Fig. 4)). In contrast, two samples also yield significantly higher Os concentrations and 187Os/188Os isotopic ratios. These data are unlike the kimberlite and melnoite data, for which the Os concentration varied but the 187Os/188Os ratio remained constant. In samples from Norway (see Table 6) the Os concentration is constant and the 187Os/188Os ratio varies. Furthermore, similar features, increasing Os concentration and isotopic composition have not been observed in the WPR-1 standard. Hence these data probably reflect real Os variation within the samples. Two other comparisons with the CRPG-CNRS laboratory yield similar results (Fig. 4). One analysis yields a low Os concentration and low 187Os/188Os ratio and the other yields a high Os concentration and high 187Os/188Os ratio. For one sample, Re data from the GEMOC and VIEPS laboratories are similar, whereas the TIMS data for other sample yield a higher Re concentration and 187Re/188Os ratio (Fig. 4). The variability in these data may be attributed to the nugget effect.
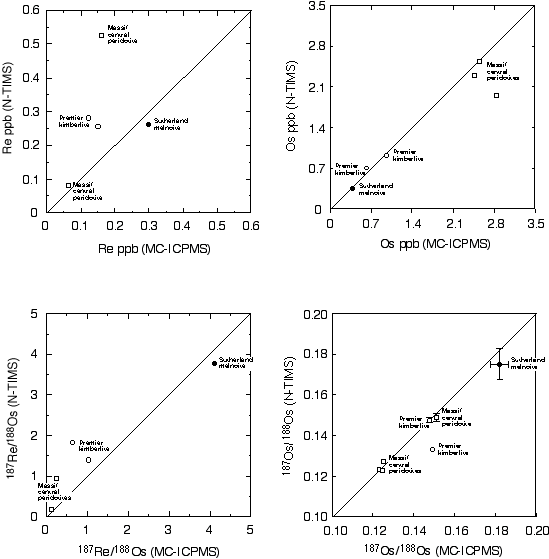
Figure 4. MC-ICPMS vs N-TIMS comparison for Re and Os concentration and isotopic data from the peridotite, kimberlite and melnoite samples.
Internal laboratory assessment
Faraday-Ion counter comparison
Following the establishment of the Faraday method, the 2-cycle 3-ion counter method was developed. It was found that there is sufficient residual hexabromosomate salt remaining in the Teflon beakers to allow the sample to be re-run using the ion counter set-up. Results from these analyses are shown in Table 5 and Figure 5. The 5 samples (of which WPR-1 was one) on average show better than 6 % reproducibility on the Os concentration and 1.5% on the 187Os/188Os ratio. Moreover, if the BL-31 MS repeat is ignored the ability to reproduce the isotopic composition improves to 0.05%. Also shown on Table 5 is a WPR-1 peridotite for which less than 0.017 grams was digested in the Carius tube, resulting in ~0.3ng Os in the procedure. The reproduction of both isotopic composition and Os concentration for this sample shows that the 2-cycle 3-ion counter method can supply isotopic data, with reasonable errors, for materials with very low Os concentrations.
Table 5. Faraday-ion counter comparison
| Sample | Os ppb | 187Os/188Os | error |
| BL-31 Faradays | 4.77 | 0.14899 | 0.00062 |
| BL-31 IC's MS repeat | 4.13 | 0.13607 | 0.00416 |
| BL-33 Faradays | 4.36 | 0.12507 | 0.00062 |
| BL-33 IC's MS repeat | 4.41 | 0.12565 | 0.00270 |
| BL-35 Faradays | 3.09 | 0.12957 | 0.00048 |
| BL-35 IC's MS repeat | 2.96 | 0.13016 | 0.00337 |
| AR-10 Faradays | 4.77 | 0.14899 | 0.00062 |
| AR-10 IC's MS repeat | 3.85 | 0.14961 | 0.00035 |
| WPR Faradays | 17.3 | 0.14653 | 0.00023 |
| WPR IC's MS repeat | 17.4 | 0.14429 | 0.00103 |
| WPR-0.017 grams | 17.0 | 0.14470 | 0.00122 |
| GEMOC WPR Mean | 16.8 | 0.14524 | 0.00035 |
Note all errors are 2SEM.
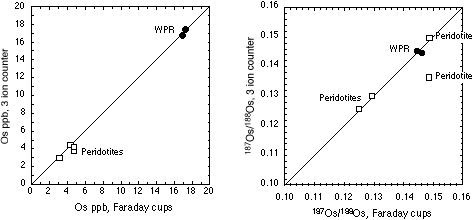
Figure 5. MC-ICPMS Os data for mass spectrometry repeats and the WPR-1 PGE standard using the 2-cycle 3 ion counter method.
5. In-situ isotopic analysis
5.1 Re-Os analysis of sulfides
The method presented here has been developed at GEMOC. The following sections are extracted from a paper on this technique titled "In-situ measurement of Re-Os isotopes in mantle sulfides by Laser Ablation Multi-Collector Inductively-Coupled Mass Spectrometry: Analytical methods and preliminary results" by Pearson, N.J., Alard. O., Griffin, W.L. and O'Reilly, S.Y. (subm.)
Introduction
The results obtained on by Alard (2000) on the distribution and concentration of HSE and especially Os, in sulfides by LAM-ICP-MS (see Chapter 6) encouraged us to develop an in-situ technique to determine Re-Os isotopes in these phases. A laser ablation system (Merchantek LUV266) has been coupled with the Nu Plasma MC-ICP-MS. The Merchantek laser sample cell was replaced with a cell designed by one of us (S.E. J.) which gave improved signal stability and precision. Typical laser operating conditions used in this study were a frequency of 5 Hz and beam energy of 3-5 mJ/pulse producing spot sizes in sulfide minerals in the range 60-120 microns. Ablation was carried out in a He atmosphere and the He-sample mixture was passed through a 30 ml mixing chamber (Norman et al., 1996) before blending with Ar prior to introduction into the ICP.
Measurements were made in static collection mode using two combinations of collectors:
masses 194, 192, 190, 189, 188, 187, 186, 185 in Faraday cups ("all-Faraday");
masses 194, 193, 192, 191, 190, 189, 188, 186 in Faraday cups; 187 and 185 in ion counters ("mixed array").
The accuracy and precision of the instrument and of the "all-Faraday" configuration allows the simultaneous measurement of Os, Re and Pt and is identical to the one used for the solution/sparging analyses of Os isotopes (see above). The repositioning of the ion beams by changing the magnet field and zoom lens voltages to direct 187 and 185 into ion counters also allows Ir to be measured in the combined Faraday-ion-counter set-up. The accuracy and reliability of the "all Faraday" set-up are demonstrated in section 4.2.2 above. The main purpose of developing the combined Faraday-ion counter technique is to be able to measure lower Os abundances by placing the smaller 187Os isotope and both Re isotopes in the ion counters. This has the advantage of improved precision on 187Os and on the Re overlap correction, but involves the cross-calibration of the ion counters with the Faradays. This procedure also assumes that the mass fractionation of Os and Ir vary sympathetically. The recent study of White et al. (2000) has cast doubt on the validity of such a method. These issues will be first assessed then an outline of the method is given.
Mass bias and overlap corrections
One of the advantages of the plasma source over the TIMS source is that isobaric interference corrections can be precisely corrected (e.g., Sm-Nd, Luais et al., 1997; Lu-Yb-Hf, Griffin et al., 2000). This is possible because the plasma source operates at a steady state, but assumes that the mass fractionation of elements of similar mass is the same or at least varies systematically (Longerich et al., 1987). A number of studies have successfully used this technique, the most common application being the use of thallium as an internal isotopic standard or 'spike' to correct for the fractionation of Pb isotopes (e.g., Walder and Furuta, 1993; Hirata 1996; Belshaw et al., 1998; Rehkamper & Halliday, 1998). The recent studies of Maréchal et al. (1999) and White et al. (2000) have investigated the validity of the assumption, specifically that the É (fractionation coefficient) values of the two elements being measured remain constant and equal under all mass spectrometer conditions. Both studies concluded that the fractionation coefficients of Cu and Zn, and Pb and Tl were not equal, but the ratios of these coefficients remained constant during the course of an analytical run. A similar approach cannot be followed to test the relative fractionation of Re and Os because Re has only two isotopes (185Re and 187Re) and one of these causes the overlap (187Re/188Os) that needs to be corrected.
Initial measurements of mixed Re-Os samples were made assuming ÉOs and ÉRe were equal and followed the method adopted by Griffin et al. (2000) for the overlap corrections of 176Lu and 176Yb on 176Hf. This method involved repeated analysis of the ANU Os standard spiked with Re and adjustment of the 185Re/187Re ratio until the correct 187Os/188Os ratio was obtained. These analyses were corrected using the exponential law and the 185Re/187Re ratio obtained by this method is 0.59734.
In order to understand the relative mass fractionation of Os and Re a series of analyses was made using iridium as an internal isotope standard. Two solutions were prepared: one is a mixture of Ir and the DTM Os standard; the other is a mixture of Ir and Re. Both solutions were analysed using an all-Faraday collector setup, the Ir-Re solution was also measured using the "mixed array". Results are presented in Figure 2.18.
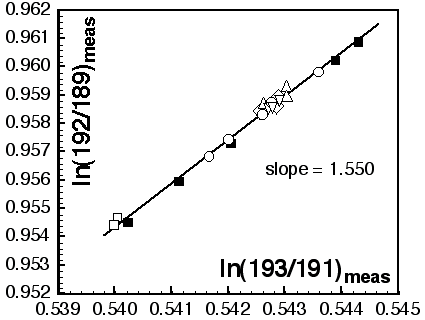
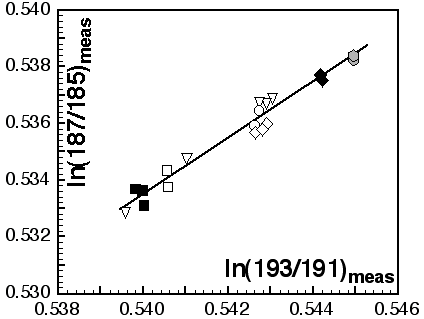
Figure 2.18:log-log plot of Ir-Re-Os mass fractionation. Symbols are for different days, all data are fitted by one line only.
Upper panel: Ir-Os mass fractionation, the slope of the fitting line is 1.550 compare to a theoretical slope of ca. 1.512 by the exponential law. 139Ir/191Ir=1.6845 (IUPAC Å1.6830) Ir fractionation factor (f) for this set of experiments ranges between ó1.83 up to ó2.20.
Lower panel: Re-Ir mass fractionation, the slope of the fitting line is 0.990 compare to 1.033 as predicted by the exponential law. 187Re/185Re =1.6741 (IUPAC=1.6739), Ir fractionation factor (f) for this set of experiments ranges between ó1.83 up to ó2.30.
The plot of ln(193/191)measured vs ln(192/189)measured (Figure 2.18) defines the relative fractionation behaviour of Ir and Os on the Nu Plasma. The experimentally determined line is derived from 7 separate analytical sessions during a period of 6 months and has a slope of 1.550 (r2=0.9912). If the fractionation coefficients for the two elements were equal then the theoretical slope of the line should be 1.512. The difference in the measured and theoretical slopes suggests a non-ideal fractionation behaviour of Ir and Os. However the data do show a consistent and reproducible relationship over time and for a range of fractionation coefficients of ó1.83 to ó2.20. Using this relationship the isotopic composition of Ir can be determined using the mass fractionation coefficient measured for Os. Normalised to 189Os/192Os = 0.39593, the corrected 191Ir/193Ir ratio is 0.59359 ± 8 (2sd) using the exponential law and 0.59378 ± 22 (2sd) using the power law. Although these values are lower than the IUPAC (1997) value for Ir (0.59418 ± 0.00037 1sd; Walczyk and Heumann, 1993) and the value measured by Chang and Xiao (1992) of 0.59399, the long term reproducibility of the Ir isotopic composition provides justification for using the measured value.
Having established a relationship for fractionation between Os and Ir, the Ir-Re solution was analysed to derive a similar relationship between Re and Ir and to evaluate the robustness of the Re187/Re185 value obtained from the mixed Re-Os analyses. The results of these analyses are presented in a plot of ln(187/185)measvs, ln(193/191)meas in Figure 2.18. As with Ir-Os, the slope (0.990, r2=0.9848) of the experimentally determined line relating the fractionation of Ir to Re differs from the theoretical value (1.033). The mass fractionation of Re was normalised to 191Ir/193Ir= 0.59359 and this gave values for 185Re/187Re = 0.59730 ± 19 (2sd) using the exponential law. This value is in excellent agreement with the IUPAC value and the value obtained by iterative correction of the mixed Re-Os solution (0.59734). Again a consistent fractionation behaviour of Re relative to Os for a range of fractionation coefficients is indicated.
The results from the Ir-Os and Ir-Re solutions show that the fractionation behaviour and relative fractionation coefficients for Os, Re and Ir can be considered as being internally consistent.
Ion counter calibration
The procedure developed for the gain calibration is an extension of the method used to establish the mass fractionation behaviour of Os, Re and Ir.
The gain calibration for IC0 (high mass ion counter) was obtained by measuring the 187Os/188Os of an Os standard with 187Os collected in IC0 and 188Os in the adjacent Faraday cup. An average of several analyses was used to adjust the gain value at the beginning of an analytical session. The stability of the gain calibration was monitored by regular analysis of the standard and shows that the drift of the ion counters is ~1% relative to the Faraday cups. Once IC0 was calibrated, a mixed Ir-Re solution was analysed with Ir measured in Faraday cups and 187Re and 185Re measured in IC0 and IC1 respectively. By this method IC1 was calibrated relative to IC0 and hence to the Faradays. Long-term drift experiments of up to 10 hours show that the drift of the ion counters relative to each other is <0.05%.
As for the all-Faraday collector setup (section 2.6), the accuracy and precision of the mixed Faraday-ion counter collector analyses is shown by repeated analysis of the Os standards. Results are presented in Table 2.18 and Figure 2.19.
The ultimate test of the mass discrimination corrections and ion-counter gain calibrations is the measurement of an Os standard spiked with Re (±Ir). Aliquots of the JM Bern Os standard were doped with different Re concentrations to give a range in 187Re/188Os ranging from Å 0.06 up to Å1.6 to test the linearity of the ion counters and the overlap corrections. The solution produces have.. The spread in Re abundances gave a range in count rates on IC1 for 185Re of 6E4 to 6E5 cps. The range in count rates for the combined 187Os and 187Re on IC0 was 5E4 to 1E6 cps. The results from these experiments show that the Re overlap can be corrected up to the maximum 187Re/188Os ca.1.6. This is in agreement with earlier results obtained on an other Os standard (Os-ANU) doped with Re (25:10 ppm) having similar 187Re/188Os (Å1.9, Figure 2.19). Thought the accuracy is good the precision decrease with high Re/Os ratio (Figure 2.19. Table 2.19). This indicates that mantle sulfide with a 187Re/188Os lower than1.6 will yield reliable 187Os/188Os. Sulfides having 187Re/188Os higher than this threshold value can not be considered "safe".
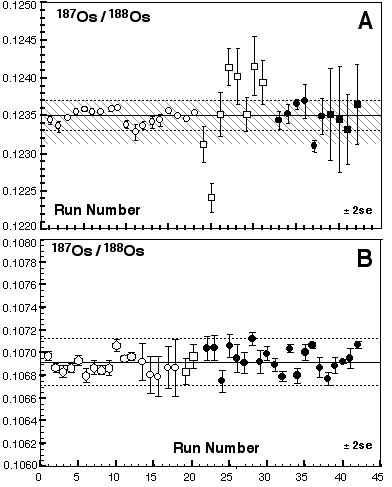
Figure 2.19: 187Os/188Os for Os-Bern Os-ANU standard by MC-ICP-MS using the "all-faraday" and "mixed-array" setup. A: Os-ANU, open symbols "all faraday"; solid symbols, combined faraday cage and ion-counter configuration ("mixed array"); circle , Os Å 95 ppb; square, Os (10 ppb) + Re (2.5 ppb). Average 187Os/188Os=0.1235±0.0002 (2sd, n=18, Os=95 ppb) compare to ANU average 187Os/188Os 0.1233±0.0003 (2sd, V. Bennett pers, comm., stippled area) B: Os-Bern; open symbols "all Faraday"; solid symbols , mixed array" setup. Hexagons, Os= 100 ppb; circle, 25 ppb; square, 10 ppb. Averages are reported in Table 2.18.
Laser Ablation
The LAM analysis has been tested using a synthetic NiS bead (PGE-A) with 204±14 ppm of Os of known isotopic composition (Ingo Horn pers. comm.) and PGE pattern (Alard et al., 2000, see also Table 2.15)
Table 2.18: Comparison of the "all-Faraday" and "mixed-array" setups by analysis of the Os-Bern standard.
| Concentration | n# | Collector | 192/188 | 1se | 190/188 | 1se | 189/188 | 1se | 187/188 | 1se | 186/188 | 1se | |
| 100ppb | avge | 2 | F | 3.079597 | 0.000084 | 1.982627 |
0.000046 |
1.219305 | 0.000033 | 0.106904 | 0.000057 | 0.120802 | 0.000016 |
| 50ppb | avge | 12 | F | 3.081122 | 0.000087 | 1.983319 |
0.000049 |
1.219600 | 0.000035 | 0.106907 | 0.000023 | 0.120449 | 0.000014 |
| 2sd | 0.003441 | 0.001196 | 0.000473 | 0.000151 | 0.000114 | ||||||||
| 25ppb | avge | 22 | F+IC | 3.079627 | 0.000216 | 1.982868 |
0.000133 |
1.219317 | 0.000085 | 0.106951 | 0.000036 | 0.120939 | 0.000046 |
| 2sd | 0.000940 | 0.000911 | 0.000372 | 0.000212 | 0.001828 | ||||||||
| 10ppb | avge | 3 | F | 3.079625 | 0.000269 | 1.982718 |
0.000165 |
1.219315 | 0.000107 | 0.106839 | 0.000083 | 0.120629 | 0.000051 |
| 2sd | 0.000797 | 0.000233 | 0.000316 | 0.000147 | 0.000433 | ||||||||
| 4ppb | avge | 2 | F+IC | 3.080427 | 0.001170 | 1.991773 |
0.000675 |
1.219633 | 0.000462 | 0.106869 | 0.000109 | 0.121476 | 0.000236 |
| avge | 41 | 3.080102 | 0.000222 | 1.983412 |
0.000133 |
1.219414 | 0.000088 | 0.106924 | 0.000040 | 0.120792 | 0.000045 | ||
| 2sd | 0.002878 | 0.004056 | 0.000794 | 0.000191 | 0.001435 | ||||||||
Table 2.19: Mass overlap, analysis of Os-Bern spiked with Re (0.06<187Re/188Os<1.6).
| Concentration | n# | Collector | 192/188 | 1se | 190/188 | 1se | 189/188 | 1se | 187/188 | 1se | 186/188 | 1se | ||||||||
| Os= 15±3 ppb + Re= 0.19±0.02 ppb | avge | 7 | F+IC | 3.080006 | 0.000270 | 1.982727 | 0.000166 | 1.219467 | 0.000107 | 0.107000 | 0.000032 | 0.120644 | 0.000046 | |||||||
| 2sd | 0.001103 | 0.000516 | 0.000436 | 0.000481 | 0.000535 | |||||||||||||||
| Os 8.4±0.6 ppb + Re 1.1±0.1 ppb | avge | 9 | F+IC | 3.079808 | 0.000292 | 1.982845 | 0.000182 | 1.219388 | 0.000116 | 0.106913 | 0.000076 | 0.121068 | 0.000059 | |||||||
| 2sd | 0.001498 | 0.000998 | 0.000593 | 0.000385 | 0.001711 | |||||||||||||||
| Os 11.6±0.6ppb + Re 3.9±0.3 ppb | avge | 2 | F+IC | 3.082138 | 0.000264 | 1.983535 | 0.000137 | 1.219848 | 0.000105 | 0.106940 | 0.000116 | 0.120760 | 0.000037 | |||||||
| Os + Re (all) | avge | 28 | 3.0800236 | 0.0002847 | 1.982865 | 0.000175 | 1.219441 | 0.000113 | 0.106937 | 0.000068 | 0.120940 | 0.000054 | ||||||||
| 2sd | 0.0019943 | 0.000979 | 0.000586 | 0.000410 | 0.001470 | |||||||||||||||
Os and Re concentrations have been determined by solution ICP-MS on several aliquots.
Analyses of PGE-A were undertaken to assess the precision of the measured 187Os/188Os as a function of signal intensity (laser energy, spot size) and analysis time. All LAM analyses were collected using the "Time Resolved Analysis" option in the Nu Plasma software. This software allows signals from each collector to be viewed in real-time to monitor the ablation process and for signal integration intervals to be selected to exclude any anomalies in the signal such as inclusions or sample heterogeneity.
Table 2.20: LAM-MC-ICP-MS analyses of PGE-A vs. integration time
| Integration Time (in s) | 30s | 60s | 100s | all |
| Reference value | 0.10645±0.00002 | |||
| "all Faraday" | ||||
| avge | 0.10657 | 0.10641 | 0.10647 | 0.10649 |
| 1sd | 0.00020 | 0.00021 | 0.00015 | 0.00039 |
| "mixed array" | ||||
| avge | 0.10636 | 0.10628 | 0.10629 | 0.10635 |
| 1sd | 0.00014 | 0.00021 | 0.00027 | 0.00031 |
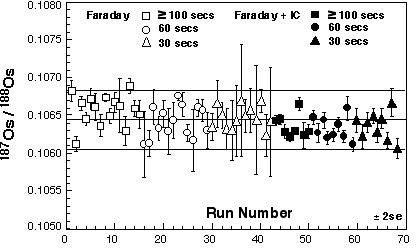
Figure 2.20. LAM-MC-ICP-MS analyses of PGE-A, using either the "all-faraday" or "mixed-array" setup. Error bars represent 2 standard error (2se). Ablation times have been varied in order to simulate "natural" sulfide ablation. Typical mantle sulfide analyses (given their small sizes) will be about 30 seconds. Note, the strong increase in precision obtained using the "mixed-array" setup. Averages 187Os/188Os ± 2sd for PGE-A are about: 0.10643±0.00040 for all collector arrays (n=68); 0.10649±0.00040 (n=43) using the "all-faraday" setup; 0.10635±0.0003 (n=25) for the "mixed-array". TIMS analysis for PGE-A has yield 187Os/188Os =0.10645±0.00002 (Ingo Horn, Pers. Comm.).
As with the solution analyses of the Os standards, better precision on 187Os/188Os in PGE-A was achieved using the combined Faraday-IC collector setup rather than the all Faraday array. Under similar laser operating conditions and run duration, a precision between 0.5% and 1% was achieved using the Faraday cup array and between 0.1% and 0.5% for the combined Faraday and IC setup (Figure 2.20, Table 2.20).
The results from the solution analyses showed that the mass fractionation of Ir could be used reliably to correct the Os isotope ratios. The benefit of using Ir to correct for mass discrimination in the laser analyses is that because of the higher relative abundances of the two Ir isotopes it should be possible to measure the mass fractionation more precisely. This is predicated on the Ir concentration in the sulfide being similar to Os, which is the case for PGE-A and has been shown by Alard et al. (2000) to be typical of mantle sulfides.
The improvement in precision on the mass discrimination coefficient using the natural abundance of Ir was small and remained dependent on the duration of the analysis and Ir concentration. In order to enhance the Ir signal a technique was developed whereby Ir is introduced to the nebuliser gas stream as a 'dry' vapour produced by desolvating an Ir solution in a CETAC MCN6000. The benefits of this method are demonstrated by reduced error (2se) for lower Os voltages as shown in Figure 2.21. This figure demonstrates also that precision on the same order of magnitude as obtained by "classical" whole rock TIMS analysis (for 5-15 ng) can be obtained for sulfides with Os contents of ca. 40 ppm.
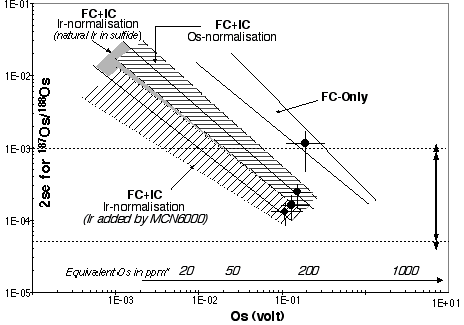
Figure 2.21: Precision on 187Os/188Os (2se) vs. Os signal intensity. 'equivalent Os in ppm*' relates Os signal and Os concentration as measured by LAM-ICP-MS on the few sulfides large enough to allow both LAM elemental and Os isotopes analysis; FC: Faraday Cup, IC= ion counter. The double arrow denotes the typical error range obtained by TIMS on typical peridotite whole rock analyses (1-15 ng Os). Using the combined FC-IC setup a precision similar to whole-rock data can be obtained for Os contents from about 40 ppm.
Drift correction was carried out by sandwiching each unknown analysis is between analyses of PGE-A, and then normalising to PGE-A. Drift was demonstrated to be linear with time.
References
Alard, O., Griffin, W.L., Lorand, J.P., Jackson, S.E. and O'Reilly, S.Y., 2000, Non-chondritic distribution of the highly siderophile elements in mantle sulfides. Nature, 407, 891-894.
Belshaw N.S, Freedman P.A., O'Nions R.K., Frank M. and Guo Y. (1998) A new variable dispersion double-focussing plasma mass spectrometer with performance illustrated for Pb isotopes. Int. J. Mass Spec. Ion. Proc.181, 51-58.
Chang, T.L. and Xiao, Y.K. (1992). J. Chinese Chim. Lett. 3, 731.
Christiansen J.N., Halliday A.N., Lee D.-C. and Hall C.M. (1995) In situ Sr isotopic analysis by laser ablation. Earth Planet. Sci. Lett. 136, 79-85.
Griffin W.L., Pearson N.J., Belousova E., Jackson S.E., O'Reilly S.Y., van Achterberg E. and Shee S.R. (2000) The Hf isotope composition of cratonic mantle: LAM-MC-ICPMS analysis of zircon megacrysts in kimberlites. Geochim. Cosmochim. Acta 64, 133-147.
Hirata, T., 1997. Isotopic variation of Germanium in iron and stony meteorites. Geochim Cosmochim Acta, 61(20): 4439-4448.
Longerich H.P., Fryer B.J. and Strong D.F. (1987) Determination of lead isotope ratios by inductively coupled plasma-mass spectrometry ICPMS. Spectrochim. Acta 42B, 39-48
Luais B., Télouk P. and Albarède F. (1997) Precise and accurate neodymium isotope measurements by plasma-source mass spectrometry. Geochim. Cosmochim. Acta 61, 4847-4854.
Maréchal C., Télouk P. and Albarède F. (1999) Precise analysis of Cu and Zn isotopic compositions by plasma-source mass spectrometry. Chem. Geol. 156, 251-273.
Norman M.D., Pearson N.J., Sharma A. and Griffin W.L. (1996) Quantitative analysis of trace elements in geological materials by laser ablation ICPMS: Instrumental operating conditions and calibration values of NIST glasses. Geostandards Newsletter 20, 247-261.
Norman M.D., Griffin W.L., Pearson N.J., Garcia M.O. and O'Reilly S.Y. (1998) Quantitative analysis of trace element abundances in glasses and minerals: a comparison of laser ablation ICPMS, solution ICPMS, proton microprobe, and electron microprobe data. Jour. Analytical Atomic Spectroscopy13, 477-482.
Rehkämper M. and Halliday, A.N. (1998) Accuracy and long-term reproducibility of lead isotope measurements by MC-ICP-MS using an external correction of mass discrimination. Int. J. Mass Spec. Ion Proc. 58, 123-133.
Todt W., Cliff R.A., Hanser A. and Hofmann A.W. (1996) Evaluation of a 202Pb-205Pb double spike for high-precision lead isotope analysis. In: Earth Processes ó Reading the isotopic code (A. Basu and S.R.Hart, eds). Geophysical Monograph 95, American Geophysical Union, pp 429-437.
Walczyk, T and Heumann, K.G. (1993). Int. J. Mass Spectr. Ion Processes123, 139.
Walder A.J. and Furuta N. (1993) High precision lead isotope ratio measurement by inductively coupled plasma multiple collector mass spectrometry. Anal. Sci.9, 675-680.
Walder A.J., Abell I.D., Platzner I. and Freedman P.A. (1993) Lead isotope measurement of NIST610 glass by laser ablation inductively coupled plasma mass spectrometry. Spectrochimica Acta 48B, 397-402.
White W.M., Albarède F. and Télouk P. (2000) High-precision analysis of Pb isotope ratios by multi-collector ICP-MS. Chem. Geol.167, 257-270.
5.2 Rb-Sr analysis of silicates and oxides
This description is taken from the following paper: Griffin, W.L., Pearson, N.J., Jackson, S.E., Andersen, T., O'Reilly, S.Y., Wang, Z. and Zhang, M. 2001. Sources of cratonic metasomatic fluids: In-situ LAM-MC-ICPMS analysis of Sr, Nd, Hf and Pb isotopes in LIMA from the Jagersfontein kimberlite. Contr. Mineral. Petrol. (subm.), with additional information on the analysis of materials with known Sr isotopic compositions.
Masses 83, 84, 85, 86, 87, 88 are measured simultaneously in Faraday collectors and all measurements are made in static mode. Corrections for mass fractionation of Sr and Rb isotope ratios are made using an exponential law using a normalising value for 86Sr/88Sr = 0.1194 (ref). The precision and accuracy of solution analysis of NBS 987 and QCD Analysts Sr standard (Lot No: 7Y38S700B2) are given in Section 4.1.2. The interference of 87Rb on 87Sr is corrected by measuring the intensity of 85Rb and using a 85Rb/87Rb = 0.38632. This value was obtained by doping the QCD Analysts Sr standard with Rb (Plasmachem Lot No: S4JS3700) and by repeated measurement to refine the value of 85Rb/87Rb necessary to give the true Sr ratio. The maximum 87Rb/87Sr ratio of the spiked solutions used in the refinement of the 85Rb/87Rb ratio was 0.3977. Although 83Kr was monitored, the need for an interference correction for 86Kr on 86Sr was eliminated by measuring the background on peak and by removing a gas blank from the signal. The accuracy of the Rb correction is demonstrated in Table 1.
Table 1. MC-ICPMS analyses of Sr isotope standards
| Strontium | |||
| 87/86 | 1se | ||
| NBS 987 | |||
| average | n=71 | 0.710263 | 0.000012 |
| 2sd | 0.000038 | ||
| GEMOC Sr | |||
| average | n=34 | 0.707616 | 0.000012 |
| 2sd | 0.000066 | ||
| GEMOC Sr + Rb (100 | ppbSr + 10 | ppb Rb) | |
| average | n=16 | 0.707647 | 0.000010 |
| 2sd | 0.000068 | ||
The accuracy and precision of the method has been evaluated by analysis of a series of materials for which TIMS data on 87Sr/86Sr were available (Table 2).
Table 2. LAM-ICPMS analyses of Sr isotope composition of known materials
| LAM-MC-ICPMS | TIMS | |||||
| Sample | Rb ppm | Sr ppm | 87Sr/86Sr | 2sd | 87Sr/86Sr | 2sd |
| MF1 (10317) | 17.7 | 7817 | 0.703721 | 0.000088 | 0.703726 | 0.00001 |
| Anorthoclase | 0.703725 | 0.000022 | ||||
| n=10 | ||||||
| MF-2 | 17.4 | 2762 | 0.703762 | 0.000055 | 0.703733 | 0.00001 |
| Anorthoclase | 0.703759 | 0.000073 | ||||
| n=3 | ||||||
| 45066/1 | 6.4 | 3528 | 0.703554 | 0.000077 | 0.703570 | 0.000006 |
| Anorthoclase | 0.703569 | 0.000020 | ||||
| n=4 | ||||||
| Batbjerg | <1 | 1720 | 0.704400 | 0.000032 | ||
| Cr-diopside | 0.704472 | 0.000034 | ||||
| (n=8) | 0.704448 | 0.000040 | ||||
| 0.704440 | 0.000073 | 0.704478 | 0.000015 | |||
| LS45235 | 0.015 | 4858 | 0.705363 | 0.000093 | 0.705343 | 0.000017 |
| Apatite | 0.705379 | 0.000035 | ||||
| n=8 | ||||||
| CaF2 | <<1 | 191 | 0.708938 | 0.000039 | 0.708873 | 0.000023 |
| Syn. fluorite | ||||||
| n=10 | ||||||
| Bold italics are error-weighted mean with 95% confidence limits | ||||||
5.3 Sm-Nd analysis of silicates and oxides
This description is taken from the following paper: Griffin, W.L., Pearson, N.J., Jackson, S.E., Andersen, T., O'Reilly, S.Y., Wang, Z. and Zhang, M. 2001. Sources of cratonic metasomatic fluids: In-situ LAM-MC-ICPMS analysis of Sr, Nd, Hf and Pb isotopes in LIMA from the Jagersfontein kimberlite. Contr. Mineral. Petrol. (subm.), with additional information on the analysis of materials with known Sr isotopic compositions.
Masses 143, 144, 145, 146, 147, 148, 150 are measured simultaneously in Faraday collectors and all measurements are made in static mode. An exponential correction for mass fractionation is applied using 146Nd/145Nd = 2.07204 to avoid an iterative correction for the interference of 144Sm on 144Nd. The value for 146Nd/145Nd is an average of results obtained on a 1ppm JMC321 Nd solution and is normalised to 146Nd/144Nd = 0.7219. The interference of 144Sm on 144Nd is corrected by measuring 147Sm and using 144Sm/147Sm = 0.2070. This value was obtained by doping the JMC321 Nd standard solution with JMC309 Sm and by repeated measurement to refine the value of 144Sm/147Sm necessary to give the 'true' Nd ratio. Solutions with Sm:Nd ratios up to 0.1ppm Sm:1ppm Nd (144Sm/144Nd = 0.00013) were analysed in this procedure. Table 1 presents average analyses of unspiked and Sm-spiked JMC321.
Table 1. Analyses of Nd isotopic standards
| Neodymium | |||||||||
| 142/144 | 1se | 143/144 | 1se | 145/144 | 1se | 148/144 | 1se | ||
| JMC 321 | |||||||||
| average | n=68 | 1.141829 | 0.000035 | 0.511132 | 0.000010 | 0.389304 | 0.000009 | 0.241534 | 0.000015 |
| 2sd | 0.000149 | 0.000040 | 0.379923 | 0.000066 | |||||
| JMC 321 + JMC309 Sm | |||||||||
| average | n=18 | 1.141703 | 0.000026 | 0.511108 | 0.000006 | 0.389427 | 0.000006 | 0.241301 | 0.000009 |
| 2sd | 0.000084 | 0.000017 | 0.000017 | 0.000310 | |||||
Table 2. Sm-Nd Analysis of Apatite
| LSR639 | 143Nd/144Nd | typ. 2SE | 147Sm/144Nd | typ 2SE |
| Apatite | ||||
| Wt. Mean (n=7) | 0.512407 | 0.000035 | 0.1661 | 0.0005 |
| 95% conf. | 0.000040 | 0.0045 | ||
| TIMS | 0.512388±7 | 0.1789±17 |
5.4 Lu-Hf analysis of Zircon
This description is taken from: Griffin, W.L., Pearson, N.J., Belousova, E., Jackson, S.E., O'Reilly, S.Y., van Achterberg, E., and Shee, S.R. 2000. The Hf isotope composition of cratonic mantle: LAM-MC-ICPMS analysis of zircon megacrysts in kimberlites. Geochim. Cosmochim. Acta 64, 133-147.
The Hf-isotope analyses reported here were carried out in-situ using a Merchantek EO LUV laser-ablation microprobe, attached to a Nu Plasma multi-collector ICPMS, at Macquarie University. Zircons were mounted in epoxy discs and polished before being imaged by cathodoluminescence and back-scattered electron techniques to look for heterogeneities (Belousova et al., 1998, 1999). Each of these grains has been analysed for Hf by electron microprobe, and for a full range of trace elements by laser-ablation ICPMS microprobe; the methods and representative analyses are published elsewhere (Belousova et al., 1998, 1999).
The Merchantek LUV laser system delivers a beam of 266 nm UV light from a frequency-quadrupled Nd:YAG laser; this beam drills flat-bottomed cylindrical pits from <10 µm to >200 µm in diameter. The spatial resolution and excellent optical viewing system of the laser microprobe allowed us to position analysis points relative to colour variations in cathodoluminescence images. During this work, we tried a wide range of spot sizes, power densities and repetition rates, with no obvious effects on fractionation-corrected isotope ratios. Most analyses therefore were carried out with a beam diameter of ca 80 µm, a 10Hz repetition rate, and energies of 0.6-1.3 mJ/pulse. This resulted in total Hf signals of 1-6x10-11 A, depending on conditions and the Hf contents, which range from 0.5-1.5% Hf (see below). Typical ablation times were 80-120 seconds, resulting in pits 40-60 µm deep. The total amount of Hf consumed in a typical single analysis was ca 50 ng.
Ar carrier gas transported the ablated sample from the laser-ablation cell via a mixing chamber to the ICPMS torch. Initial setup of the instrument was done using a 1 ppm solution of JMC475 Hf, spiked with 80 ppb Yb, which typically yielded a total Hf beam of 10-14 x 10-11 A.
The Nu Plasma MC-ICPMS features a unique geometry with a fixed detector array of 12 Faraday cups and 3 ion counters; beams are directed into the collectors by varying the dispersion of the instrument using an electrostatic zoom lens. For this work we analysed masses 172, 175, 176, 177, 178, 179 and 180 simultaneously in Faraday cups; all analyses were carried out in static-collection mode. Data were normalised to 179Hf/177Hf = 0.7325, using an exponential correction for mass bias.
Interference of 176Lu on 176Hf was corrected by measuring the intensity of the interference-free 175Lu isotope and using the recommended 176Lu/175Lu = 0.02669 (DeBievre and Taylor, 1993) to calculate 176Lu/177Hf. Similarly, the interference of 176Yb on 176Hf was corrected by measuring the interference-free 172Yb isotope and using 176Yb/172Yb to calculate 176Yb/177Hf. The appropriate value of 176Yb/172Yb was determined by successive spiking the JMC475 Hf standard (1 ppm solution) with Yb, and iteratively finding the value of 176Yb/172Yb required to yield the value of 176Hf/177Hf obtained on the pure Hf solution. Our 176Yb/172Yb (0.5865) is higher than the IUPAC value of 0.5799 (DeBievre and Taylor, 1993), but within the range of published values (Platzner, 1997). Thirlwall and Walder (1995), using a Plasma 54 MC-ICPMS, found that a value of 176Yb/173Yb slightly higher than the IUPAC value was required to match the accepted value of 176Hf/177Hf in Yb-spiked solutions of the JMC475 Hf standard.
The measured 176Lu/177Hf ratios are used here to calculate initial 176Hf/177Hf ratios. The typical 2SE uncertainty on a single analysis of 176Lu/177Hf is ±1-2%; at the low Lu/Hf ratios considered here, this contributes an uncertainty of <0.001 εHf unit.
The reproducibility of the Hf isotope analyses is demonstrated by 40 Hf analyses on a 1ppm solution of the JMC475 Hf standard (Table 2); our mean value for 176Hf/177Hf is identical to the recommended value of Nowell et al. (1998d; 0.28216). This analysis series covers a period of six months beginning two weeks after delivery of the instrument, and encompasses the period of the laser-ablation analyses reported here. The same data are given for 17 analyses of the Yb-spiked JMC475 solution, all done over the two-week period that included the analysis of the zircons. These data illustrate the precision and accuracy obtainable on the 176Hf/177Hf ratio, despite the severe corrections on 176Hf. In typical analyses of kimberlitic zircons, which have very low Lu and Yb contents, the Lu correction to 176Hf/177Hf is ca 100 ppm, while the Yb correction is ca 0.1% (Table 3).
The laser-ablation analyses were carried out using the time-resolved analysis software, in which the signal for each mass and each ratio is displayed as a function of time during the analysis. This allows the more stable portions of the ablation to be selected for analysis, before the data are processed to give the final results. Background was collected on peak for 45 seconds before ablation began. Following each analysis, the 180Hf signal was followed down to background before starting the next analysis; this typically took less than one minute. Most grains were analysed in duplicate; more spots were taken where heterogeneity was suspected from cathodoluminescence images or previous trace-element analyses, or where the first two analyses differed by more than experimental uncertainty (2SE). Typical within-run precision (2SE) on the analysis of 176Hf/177Hf is ±0.000020, equivalent to an uncertainty of less than one epsilon unit. The mean deviation of 176Hf/177Hf between replicate analyses of the same grain (Table 3) is ±0.000017, indicating both that the measured analytical uncertainties are realistic, and that most grains are homogeneous.
To evaluate the accuracy and precision of the laser-ablation results, we have repeatedly analysed two zircon standards, 91500 and 61.308, both described by Weidenbeck et al. (1995). The results are shown in Table 2, along with the mean of all TIMS results of Corfu (in Weidenbeck et al., 1995).
Zircon 91500 appears to be a reliable standard material; it is quite homogeneous in terms of Yb and Lu contents, as well as in isotopic composition, although the observed range in 176Hf/177Hf lies just outside 3SD of the mean. Corfu (in Weidenbeck et al., 1995) rejected one outlying TIMS value (of 7), but our data indicate that the rejected value represents a significant population in the sample and should be included. The agreement between the Lu content calculated using our mean 176Lu/177Hf value for zircon 91500 and the Hf content given by Corfu confirms the accuracy of the measured 176Lu/177Hf values (Table 2). Zircon 61.308 is more heterogeneous in Lu and Yb; two populations are clearly present (Fig. 1). It also appears to be less homogeneous in 176Hf/177Hf than zircon 91500 (Fig. 1, Table 2).
The 176Hf/177Hf values measured for these standards compare well with the TIMS results, and the means of the 178Hf/177Hf measurements are within error of the accepted values. There is no correlation of 176Hf/177Hf with either 176Lu/177Hf or 176Yb/177Hf; this is clearly seen in 61.308 where two populations with different Yb/Hf are present (Fig. 1), and indicates that the correction procedures adopted here produce accurate, as well as precise, results.
Table 1. Analyses of Lu-Hf solutions and Zircon standards
| Sample | Yb (ppm) | Lu (ppm) | Hf (ppm) | 176Lu/177Hf | 176Hf/177Hf | ±2SD | 178Hf/177Hf | ±2SD | ||||||
| JMC475 Hf | (1ppm sol.) | - | 0.282161 | 0.000034 | 1.46725 | 0.00006 | ||||||||
| (n=40) | ||||||||||||||
| JMC475 Hf (+Yb) | 0.08 | 1 | 0.282167 | 0.000020 | 1.46720 | 0.00004 | ||||||||
| (n=17) | 176Yb/177Hf=0.055 | |||||||||||||
| Zircon 91500 | 62.5 | 13.9 | 0.000295 | 0.282297 | 0.000044 | 1.46716 | 0.00017 | |||||||
| (n=60) | (12.4)* | |||||||||||||
| TIMS (n=7) | 12 | 5895 | 0.000288 | 0.282290 | 0.000014 | 1.46714 | 0.00001 | |||||||
| Zircon 61308 | 352 | 78.3 | 0.00078 | 0.282990 | 0.000100 | 1.46726 | 0.00032 | |||||||
| (n=24) | (0.00016-0.002) | |||||||||||||
| TIMS (n=9) | 83 | 5658 | 0.002070 | 0.282975 | 0.000050 | 1.46714 | 0.00001 | |||||||
| Yb and Lu concentrations by LAM-ICPMS; TIMS data from Weidenbeck et al. (1995) | ||||||||||||||
| * Lu calculated from 176Lu/177Hf and given Hf content | ||||||||||||||
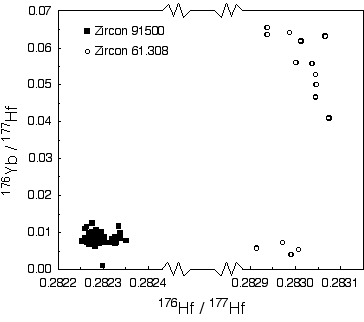
Figure 1. Analyses of Zircon Standards
References
DeBievre P. and Taylor P.D.P. (1993) Table of the isotopic composition of the elements. Int. Jour. Mass Spectrom. Ion Processes123, 149.
Platzner I.T. (1997) Modern isotope ratio mass spectrometry. John Wiley & Sons, Chichester. 514 pp.
Thirlwall M.F. and Walder A.J. (1995) In situ hafnium isotope ratio analysis of zircon by inductively coupled plasma multiple collector mass spectrometry. Chem. Geol. 122, 241-247.
Weidenbeck M., Alle P., Corfu F., Griffin W.L., Meier M., Oberli F., Von Quadt A., Roddick J.C. and Spiegel W. (1995) Three natural zircon standards for U-Th-Pb, Lu-Hf trace element and REE analyses. Geostandards Newsletter19, 1-24.
5.5 Pb isotope analysis in oxides
This description is taken from the following paper: Griffin, W.L., Pearson, N.J., Jackson, S.E., Andersen, T., O'Reilly, S.Y., Wang, Z. and Zhang, M. 2001. Sources of cratonic metasomatic fluids: In-situ LAM-MC-ICPMS analysis of Sr, Nd, Hf and Pb isotopes in LIMA from the Jagersfontein kimberlite. Contr. Mineral. Petrol. (subm.), with additional information on the analysis of materials with known Pb isotopic compositions.
The procedure used for Pb follows that described by Belshaw et al. (1998) for the Nu Plasma instrument. Masses 202, 203, 204, 205, 206, 207, 208 were measured simultaneously in Faraday collectors and all measurements were made in static mode. Thallium (NBS 997) was used to correct for mass fractionation using an exponential correction and a value of 205Tl/203Tl = 2.3875 (Belshaw et al., 1998). Results for NBS 981 are presented in Table 1, along with data by TIMS analysis (Todt et al., 1996) and MC-ICPMS determinations by Belshaw et al. (1998), Rehkämper & Halliday (1998) and White et al. (2000). The natural abundance of Tl in the LIMA is too low to be measured with the precision necessary for the mass bias correction. This problem was overcome by using a CETAC MCN6000 desolvating nebuliser to produce a dry Tl-aerosol that is mixed with the sample-gas stream from the laser ablation cell. A correction for the interference of Hg is applied to 204Pb in the solution analyses of NBS 981 but is unnecessary for the laser analyses due to the subtraction of a gas blank.
Table 1. MC-ICPMS analyses of Pb isotopic standards
| Lead | |||||||||||
| 208/204 | 207/204 | 206/204 | 208/206 | 207/206 | |||||||
| NBS 981 | |||||||||||
| average | n=40 | 36.6986 | 15.4917 | 16.9376 | 2.16685 | 0.91471 | |||||
| 2sd | 0.0090 | 0.0035 | 0.0046 | 0.00015 | 0.00005 | ||||||
| Todt et al., (1996) TIMS | 36.7006 | 15.4891 | 16.9356 | 2.16701 | 0.91459 | ||||||
| Belshaw et al., (1998) | 36.6710 | 15.4830 | 16.9290 | 2.16610 | 0.91455 | ||||||
| Rehkämper & Halliday (1998) | 36.6671 | 15.4818 | 16.9295 | 2.16589 | 0.91438 | ||||||
| White et al., (2000) | 36.6826 | 15.4899 | 16.9467 | 2.16460 | 0.91404 | ||||||
Table 2. LAM-MC-ICPMS analyses of Pb isotopes in NIST glasses
| Lead | 207/204 | 206/204 | 208/206 | 207/206 |
| NBS 981 (solution) | ||||
| aver. (n=40) | 15.4917 | 16.9376 | 2.1668 | 0.914710 |
| 2sd | 0.0035 | 0.0046 | 0.0002 | 0.000053 |
| NIST610 LAM | ||||
| mean (n=6) | 15.458 | 16.9950 | 2.1673 | 0.90967 |
| 2sd | 0.004 | 0.0040 | 0.0009 | 0.00015 |
| NIST610 TIMS | 15.51±1 | 17.05±1 | 2.170±2 | 0.9095±10 |
References
Belshaw N.S, Freedman P.A., O'Nions R.K., Frank M. and Guo Y. (1998) A new variable dispersion double-focussing plasma mass spectrometer with performance illustrated for Pb isotopes. Int. J. Mass Spec. Ion. Proc.181, 51-58.
Galer S.J.G. and Goldstein S.L. (1996) Influence of accretion on lead in the Earth. In: Earth Processes ó Reading the isotopic code (A. Basu and S.R.Hart, eds). Geophysical Monograph 95, American Geophysical Union, 75-98.
Rehkämper M. and Halliday, A.N. (1998) Accuracy and long-term reproducibility of lead isotope measurements by MC-ICP-MS using an external correction of mass discrimination. Int. J. Mass Spec. Ion Proc. 58, 123-133.
Todt W., Cliff R.A., Hanser A. and Hofmann A.W. (1996) Evaluation of a 202Pb-205Pb double spike for high-precision lead isotope analysis. In: Earth Processes ó Reading the isotopic code (A. Basu and S.R.Hart, eds). Geophysical Monograph 95, American Geophysical Union, pp 429-437.
White W.M., Albarède F. and Télouk P. (2000) High-precision analysis of Pb isotope ratios by multi-collector ICP-MS. Chem. Geol.167, 257-270.
5.6 U-Pb dating of zircon by LAM-ICPMS
The following description is adapted from Appendix D of: Griffin, W.L., Belousova, E.A., Walters, S.G. and O'Reilly, S.Y. 2000. LAM-ICPMS analysis of detrital zircons: TerraneChron® applications in the Mt. Isa Eastern Succession. Report to BHP Exploration. 156 pp.
Sample Preparation
Samples used for TerraneChron® are generally routine heavy mineral concentrates prepared by commercial laboratories. Zircon is an extremely resistate phase that reports in the non-magnetic fraction. Picking is carried out using a high intensity Leica UV microscope, which allows rapid identification of zircon grains without the need for additional (and expensive) heavy media separation. The grains are mounted in epoxy discs and polished to expose the grains. The mounts are then examined using backscatter electron (BSE) microprobe imaging to record internal zonation features and external morphology prior to selecting grains/ points for analysis. Igneous zircons typically show oscillatory zones of rhythmic growth, where zones of dark BSE represent low mean atomic weight. The Y, U and Th contents tend to change abruptly across the BSE contrasts together with displacements in the REE pattern, while there are only small variations in the Hf content between the individual zones (Hinton & Upton, 1991).
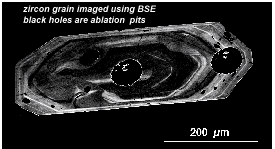
Figure 1. Back-scattered electron/CL image of a zircon grain, showing oscillatory zoning and typical laser-ablation pits.
Electron microprobe (EMP) analysis
The GEMOC CAMEBAX SX50 electron microprobe is used for precise analysis of Hf, U, Th and Y in individual grains. These elements provide discriminants that can be used to recognise broad categories of magmas from which the zircons crystallised. The Hf data also allow Yb/Hf and Lu/Hf ratios collected during Hf isotope analysis (see below) to be converted to concentrations, providing further information on host rock chemistry.
U-Pb isotope analysis
U-Pb age determinations are carried out at the GEMOC Key Centre (Macquarie University) using Laser Ablation ICP-MS. Mounted zircons are sampled using a focussed UV laser with the ablated micro-particulate material transferred in a continuous flow of helium to an ICP-MS for isotopic quantification. As in SIMS analysis, a concordant zircon standard sampled under identical conditions to the unknown, is used to calibrate the analyses. This corrects for the effects of laser sampling/transport-related fractionation of Pb and U, which is somewhat matrix-dependent, and mass bias of the ICP-MS (Jackson et al., 1996, 1997).

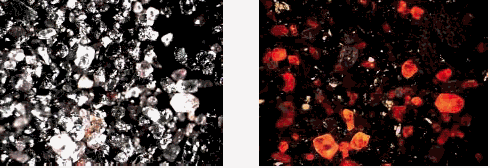
Figure 2.Leica UV microscope (top left) and examples of concentrates in plain light (bottom left) and in UV light with orange fluorescing zircons.
LAM-ICP-MS analyses are performed using a custom built UV LAM (Norman et al., 1996) coupled to a Hewlett Packard HP4500. The laser microprobe directs a UV laser beam through a petrographic microscope that provides both delicate focussing and excellent viewing optics for sample location. To minimise U/Pb fractionation related to the relative change in focus of the laser beam as it penetrates into the sample (Hirata and Nesbitt, 1995), all analyses are performed with the laser focused above the sample (typically ~ 200 µm). Laser operating conditions (laser energy and degree of defocusing - Table 1) are established for each run of 20-40 analyses, based upon the grain size of zircons to be analysed. Identical conditions are then rigorously maintained throughout each run to ensure constant U/Pb fractionation. Ablation pit size is generally in the order of 50 µm. The sample mount and standards are ablated in a custom-built sample chamber and the ablated material is transported to the ICPMS by He carrier gas. This technique significantly reduces the elemental fractionation of U relative to Pb during ablation (Jackson et al., 1997). It should be noted that the effect of any uncorrected U-Pb fractionation is to move data points along a chord corresponding to zero-age Pb loss, without affecting the 207 Pb/206 Pb ages. The ICPMS is optimised using continuous ablation of a zircon standard to provide maximum sensitivity while maintaining low oxide formation (ThO+/Th+ <1%). ICPMS operating conditions and data acquisition parameters are listed in Table 1. Data are acquired on five isotopes using the instrument's time-resolved analysis data acquisition software. Extremely rapid peak hops and short dwell times (measurement time on peak) are used to provide quasi-simultaneous measurement of the five masses, thus providing greater precision than typically is possible with the relatively noisy ICPMS source (Jackson et al., 1997). The time-resolved analysis software records signal intensity data (cps) for each mass sweep performed by the mass spectrometer. These are pre-integrated on-line by averaging consecutive groups of 15 mass sweeps into single readings each representing about 1 second of data acquisition. Time-resolved analysis data (a proxy for ablation depth) generally allow isotopic heterogeneity within the ablation volume to be clearly identified (e.g., zones of Pb loss or common Pb related to fractures or areas of radiation damage, inclusions, inherited cores, etc.).
Background and ablation data for each analysis are collected over ~30-120 seconds, with background measurements being taken over the first ~60 seconds prior to initiation of ablation. The raw data are processed using GLITTER, our in-house on-line data reductionprogram. 207Pb/206Pb, 208Pb/206Pb, 208Pb/232U, 206Pb/238U and 207Pb/235U (235U = 238U/137.88) ratios are calculated for each reading and the time-resolved ratios for each analysis carefully examined. Optimal signal intervals for the background and ablation data are selected for each sample and matched with identical time intervals for the zircon standards. Net background-corrected count rates for each isotope are then used for calculation of sample ages and precision.
Table 1. Operating conditions for U-Pb analysis
ICP-MS Model HP 4500 (Series 300)
Forward power 1350 KW
Gas flows:
Plasma Ar 13 L/min
Auxilliary Ar 0.8 L/min
Carrier He ca. 1 L/min
LAM
Wavelength 266 nm
Repetition rate 10 Hz
Pulse duration (FWHM) 6 ns
Focusing objective 10X, UV laser achromat, f.l. = 20 mm
Degree of defocusing 200 µm (above sample)
Incident pulse energy 0.5-0.9 mJ
Data acquition parameters
Data acquisition protocol Time Resolved Analysis
Scanning mode Peak hopping, 1 point per peak
Isotopes determined 206Pb, 207Pb, 208Pb, 232Th, 238U
Analyses of an in-house zircon standard (#02123 or GEMOC-GJ1) are used to correct for the effects of ablation/transport-related U/ Pb fractionation and mass bias of the mass spectrometer. This methodology gives 206Pb/238U and 207Pb/206Pb ages with precision and accuracy comparable to that of most ion-probe data, while the precision of 207Pb/235U ages is somewhat lower. All three ages are reported with ± 2 SD uncertainties calculated directly from the integrated repeat isotopic ratio measurements. The precision and accuracy obtainable with this technique are illustrated by comparison with TIMS data on some well-characterised zircons (Table 2).
Table 2. LAM-ICPMS U-Pb data on standard zircons
| TIMS | LAM-ICPMS Data, GEMOC | |||||||||||||||||
| Sample | 207/206 | 206/238 | mswd | 207/235 | mswd | 207/206 | mswd | |||||||||||
| BR266 | 562.1±0.6 | R. Stern, Pers. Comm. 2000 | ||||||||||||||||
| n=10 | 573±5 | 15 | 564±4 | 9.1 | 531.1±5.7 | 0.43 | ||||||||||||
| n=8 | 574±4 | 8 | 566±3 | 3 | 530.9±6.4 | 0.54 | ||||||||||||
| Twin Lakes | 435±2 | G. Dunning, Pers. Comm. 2000 | ||||||||||||||||
| n=13 | 423±10 | 2.4 | 423±11 | 4.3 | 428±61 | 4.1 | ||||||||||||
| RIG8 | 1617±14 | S. Jackson, Pers. Comm. 2000 | ||||||||||||||||
| n=10 | 1558±54 | 189 | 1594±29 | 50 | 1622±8 | 0.97 | ||||||||||||
| n=9 | 1596±25 | 30 | 1610±11 | 6.3 | 1623±8 | 1.04 | ||||||||||||
| UQZ1 | 1143±1 | Machado & Gauthier (1996; n=9) | ||||||||||||||||
| n=33 | 1136±14 | 4.7 | 1134±11 | 5 | 1135±9 | 6.2 | ||||||||||||
| Mud Tank | 732±5 | Black & Gulson (1978; n=5) | ||||||||||||||||
| n=42 | 731±3 | 1.6 | 729±3 | 1.3 | 724±12 | 1.6 | ||||||||||||
| 91500 | 1065.4±0.5 | Weidenbeck et al. (1965; n=11) | ||||||||||||||||
| n=11 | 1062±6 | 0.47 | 1064±5 | 0.24 | 1069±16 | 0.39 | ||||||||||||
| LAM-ICPMS 206/238 ages preferred for samples with age <1 Ga; 207/206 ages preferred for older samples | ||||||||||||||||||
References
Belousova, E. A., Griffin, W.L. and Pearson, N.J. 1998. Trace element composition and cathodoluminescence properties of kimberlitic zircons from southern Africa.. Mineral. Magazine 62, 355-366.
Belousova, E.A., 2000. Trace elements in zircon and apatite: application to petrogenesis and mineral exploration. PhD thesis, Macquarie University, Australia.
Hirata, T. and Nesbitt, R.W., 1995. U-Pb isotope geochronology of zircon: Evaluation of the laser probe-inductively coupled plasma-mass spectrometry technique. Geochemica et Cosmochemica Acta, 59, 2491-2500.
Jackson, S. E., Horn, I., Longerich, H. P. and Dunning, G. R., 1996. The application of Laser Ablation Microprobe (LAM)-ICP-MS to in situ U-Pb zircon geochronology: Keynote address, V.M., Goldschmidt Conference, Heidelberg, Germany, March 1996, Journal of Conference Abstracts 1, p.283.
Jackson, S.E., Dunning, G.R., Horn, I. and Longerich, H.P. 1997. The application of laser ablation microprobe (LAM)-ICP-MS to in situ U-Pb zircon geochronology: Keynote address, GAC/MAC Joint Annual Meeting, Ottawa, Ontario, May 1997, Abstract Volume, p. A73.
Ludwig, K. R. 2000. Isoplot - a geochronological toolkit for Microsoft Excel. Berkeley Geochronology Center, Special PublicationNo. 1a, 53pp.
Norman, M.D., Pearson, N.J., Sharma, A. and Griffin, W.L. 1996. Quantitative analysis of trace elements in geological materials by laser ablation ICPMS: Instrumental operating conditions and calibration values of NIST glasses. Geostandards Newsletter, 20, 247-261.
Norman M.D., Griffin W. L., Pearson N. J., Garcia M. O., and O'Reilly S. Y. 1998. Quantitative analysis of trace element abundances in glasses and minerals: a comparison of laser ablation ICPMS, solution ICPMS, proton microprobe, and electron microprobe data. Journal of Analytical Atomic Spectroscopy 13, 477-482.
Weidenbeck, M., Alle, P., Corfu, F., Griffin, W.L., Meier, M., Oberli, F., Von Quadt, A., Roddick, J.C. and Spiegel, W. 1995. Three natural zircon standards for U-Th-Pb, Lu-Hf, trace element and REE analyses. Geostandards Newsletter 19, 1-24.