 GEMOC ARC National Key Centre
Lithospheric boundaries on the eastern Siberian platform
Yvette H. Poudjom Djomani 1, * William L. Griffin 1, Suzanne Y. O’Reilly 1, Lev Natapov 1, Yuriy Erinchek 2 and Jon Hronsky 3.
1. GEMOC Key Centre Dept of Earth & Planetary Sciences Macquarie University, NSW, Australia
2. VSEGEI, St Petersburg, Russia.
3. WMC Resources, WA, Australia
SUMMARY
The regional mapping of large lithospheric blocks can provide guidance for mineral exploration, because such large-scale structures, and particularly the boundaries between them, may control the emplacement of several types of large ore bodies. This study uses a combined analysis of potential-field geophysical data and mantle petrology, to map major lithospheric structures on the eastern part of the Siberian platform. Garnet and chromite concentrates from a chain of Paleozoic to Mesozoic kimberlites across the platform have been used to construct mantle sections. These sections reveal that the lithospheric mantle shows significant differences, corresponding to tectonic terranes mapped at the surface, and indicating that the terrane boundaries are translithospheric. Furthermore, the Archean terranes are underlain by typical depleted Archean lithosphere > 200km thick, while the Proterozoic terranes are underlain by thinner and less depleted lithosphere.
We inverted gravity and topography data from the Siberian platform to determine the flexural rigidity or elastic plate thickness (Te), which is a measure of the mechanical strength of the lithosphere. The results of this inversion reveal a major zone, ~ 150km wide, of very weak lithosphere (Te < 10km) running N-S across the western part of the craton. This zone coincides with thicker lithosphere, lower surface heat flow and abnormally high sub-Moho P-wave velocities suggesting an anisotropy in the upper mantle. The kimberlite fields in the Archaean part of the platform are localised on the western flank of this zone of weak lithosphere. We suggest that the low Te reflects a mantle shear zone which has been a preferred conduit for fluids (eg magmas) into the lower crust, and has controlled the location of kimberlite emplacement in the area.
Key words: Siberia lithosphere, mantle xenoliths, mantle
structure, elastic thickness, gravity modelling.
INTRODUCTION
The Siberian Platform (Figure 1) represents a relatively stable
area, surrounded by major Phanerozoic suture zones formed during
the assembly of the Pangean supercontinent during the Paleozoic
and Mesozoic. The craton now is largely covered by 2-14km of Riphean
to Lower Cretaceous sediments and Triassic traps; outcrops of
basement occur in the Anabar and Aldan shields, and in a small
area of the Olenek uplift in the northeast part of the study area
(Figure 1). Provinces and terranes within the craton have been
mapped on the basis of known crustal shear zones, boreholes to
basement, crustal xenolith suites in kimberlites, and especially
by regional-scale magnetic anomaly patterns. A 1000-km long kimberlite
field with ages ranging from Paleozoic to Mesozoic runs NNE from
the centre of the craton to its northern margin. Mantle material
from these kimberlites has been analysed to construct mantle sections
(O'Reilly and Griffin, 1996; Ryan et al., 1996). On this traverse,
the boundary between the Archean root and the Proterozoic mantle
is marked by the abrupt disappearance of harzburgitic and wehrlitic
rocks. The objectives of this study are to carry out a systematic
elastic thickness (Te) analysis of the northeastern part
of the Siberian Platform, to investigate the correlations between
Te and known terrane boundaries, mantle structure and composition,
and finally to see if the Te analysis offers clues to the
structures controlling the distribution of the kimberlites.
METHODS
For the purpose of this study, we have used two main methods to analyse mantle material and geophysical data. Mantle-derived xenoliths and xenocrysts have been used to obtain information on the thermal state and composition of the lithosphere beneath individual volcanic fields in the world using techniques developed by O'Reilly and Griffin (1996) and Ryan et al. (1996). These techniques provide an estimate of the paleogeotherm, which serves as a reference for determining the depth of origin of individual mineral grains (garnet, chromite) for which temperatures are determined by trace-element thermometers (Ryan et al., 1996). The depth to the base of the chemically defined lithosphere is determined by the change from depleted (lithospheric) to undepleted (asthenospheric) trace-element signatures in garnet (Griffin and Ryan, 1995). In principle, geophysical data can be correlated with differences in mantle type, and used to extend the petrological mapping beyond the limited areas sampled by the volcanic fields. The geophysical method used in this study is based on the wavelength relationship between gravity and topography data (Forsyth, 1985, Poudjom Djomani et al., 1995) to estimate the flexural rigidity (D) of the lithosphere, or equivalently its effective elastic thickness (Te). This technique is used to map major lithospheric domains with different geophysical properties. A combined interpretation of the mantle petrology and geophysical data on the Siberian platform allows the definition of fundamental lithospheric terranes with different stabilisation ages and their control on the occurrence of mineral deposits.
RESULTS AND CONCLUSIONS
Garnet and chromite concentrates from a chain of kimberlites
on the eastern Siberian platform have been analysed using the
methods described above. The mantle sections constructed from
this analysis reveal that the Archean terranes are underlain by
typical depleted Archean lithosphere > 200km thick, while the
Proterozoic terranes are underlain by thinner and less depleted
lithosphere (Figure 1). A low geotherm, corresponding approximately
to a 35 mW/m2 conductive model, characterised the lithosphere
in Devonian time beneath the Magan and Anabar crustal provinces;
this is consistent with the known or inferred presence of Archean
depleted granulites in the upper (and presumably lower) crust.
The Devonian geotherm beneath the northern fields is higher, rising
to near a 40 mW/m2 conductive model. The areas intruded by Mesozoic
kimberlites are generally characterised by this higher, but still
"cratonic" geotherm.
Figure 1. Upper: Terrane map of the northeastern Siberian craton showing the variation in Bouguer anomaly along the main trends of the kimberlites. Lower: Structure of the lithosphere along the main kimberlite trend derived from the analysis of mantle material. The section shows the thicker and more depleted lithosphere (> 30% harzburgite) beneath the Archean terranes.
The geophysical analysis results are presented as a contour map of the effective elastic thickness (Te) of the Siberian platform (Figure 2). This map shows that the lithosphere is relatively weak in the Eastern Siberian platform and the Te varies between 8km and 44km. The high values occur over the eastern part of the platform and the Akitkan foldbelt that bounds the craton on the southeast. An important feature on the map is a zone of relatively low Te values, running N-S on the western part of the platform. The low-Te zone follows a zone of thick lithosphere in the Archean provinces, and seismic data show that this zone is characterised by a thick, mafic lower crust consistent with intrusion of basaltic magmas near the crust-mantle boundary. The flanks of this zone also display high values of sub-Moho Vp, which may be evidence of strong mantle anisotropy. Finally, the known kimberlite intrusions, especially within the Archean provinces, are concentrated along the flanks of the low-Te zone, which suggests that this structure reaches well into the lithospheric mantle.
We therefore suggest that the N-S zone of low Te represents a major mantle shear zone, 100-150km wide, which has been responsible for significant weakening of the lithosphere. Such a shear zone could guide the intrusion of mafic magmas that have produced the thick mafic lower crust, as well as the intrusion of kimberlites. Fluids passing along this zone could also alter its composition, which might account for its anomalous density relative to the mantle on either side.
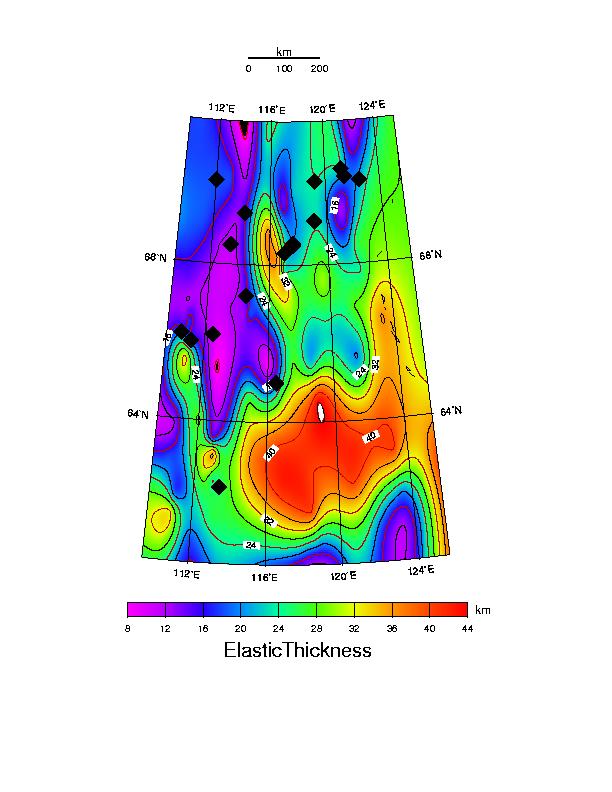
Figure 2. Effective Elastic Thickness (Te) colour contour map of the eastern Siberian platform. The black diamonds represent the kimberlites intruded through the lithospheric mantle of the platform.
ACKNOWLEDGEMENTS
The authors would like to thank the Ministry of Natural Resources of the Russian Federation (St Petersburg, Russia) who provided the gravity and topographic data used in this study. Financial assistance for this study came from a collaborative grant between WMC Resources and Macquarie University, ARC grant to SYO, and DETYA funding to GEMOC Key Centre (www.es.mq.edu.au/gemoc).
REFERENCES
O'Reilly, S.Y. and Griffin, W.L., 1996, 4-D lithosphere mapping: a review of the methodology with examples: Tectonophysics 262, 3-18.
Ryan, C.G., Griffin, W.L. and Pearson, N.J., 1996, Garnet geotherm: a technique for derivation of P-T data from Cr-pyrope garnets: Journal of Geophysical Research 101, 5611-5625.
Griffin, W.L. and Ryan, C.G., 1995, Trace elements in indicator minerals: area selection and target evaluation in diamond exploration: Journal of Geochemical Exploration 53, 311-337.
Forsyth, D.W., 1985, Subsurface loading and estimate of flexural rigidity of continental lithosphere: Journal of Geophysical Research 90, 12623-12632.
Poudjom Djomani, Y.H., Nnange, J.M., Diament, M., Ebinger, C.J. and Fairhead, J.D., 1995, Effective elastic thickness and crustal thickness variations in West-Central Africa inferred from gravity data: Journal of Geophysical Research 100, 22047-22070.
![]()